UNITED STATES
SECURITIES AND EXCHANGE COMMISSION
Washington,
D.C. 20549
Form 6-K
REPORT OF FOREIGN PRIVATE ISSUER PURSUANT TO RULE 13a-16 OR 15d-16 UNDER THE SECURITIES EXCHANGE ACT OF 1934
For the month of March 2026
Commission File Number: 001-41421
Alvotech
(Translation of registrant's name into
English)
9, Rue de Bitbourg,
L-1273 Luxembourg,
Grand Duchy of Luxembourg
(Address of
principal executive office)
Indicate by check mark whether the registrant files or will file annual reports under cover of Form 20-F or Form 40-F.
Form 20-F
[ X ] Form 40-F [ ]
Incorporation by Reference
This Report on Form 6-K (this “Report”) of Alvotech (the “Company”) excluding Exhibits 99.1, 99.2 and 99.3 attached hereto, shall be deemed to be incorporated by reference into the Company’s registration statements on Forms F-3 (File Nos. 333-266136, 333-273262, 333-275111 and 333-281684), the Company’s registration statement on Form F-3ASR (File No. 333-289006), and the Company’s registration statement on Form S-8 (File No. 333-266881) and to be a part thereof from the date on which this Report is filed, to the extent not superseded by documents or reports subsequently filed or furnished.
Exhibits 99.1, 99.2 and 99.3 to this Report are being furnished and shall not be deemed “filed” for purposes of Section 18 of the Securities Exchange Act of 1934 (the “Exchange Act”) or otherwise subject to the liabilities of that section, nor shall it be deemed incorporated by reference in any filing under the Securities Act of 1933 or the Exchange Act.
Press Release
On March 18, 2026, Alvotech issued a Press Release announcing the Financial Results and Business Update for Q4 2025 and the full year. A copy of the Press Release is furnished herewith as Exhibit 99.1.
Earnings Report and Presentation
On March 18, 2026, Alvotech made public a more detailed earnings report with Financial Results and Business Update for Q4 2025 and the full year. A copy is furnished herewith as Exhibit 99.2. The Company also made public its Earnings Call Presentation. A copy is furnished herewith as Exhibit 99.3.
EXHIBIT INDEX
| Exhibit Number | Description | |
| 99.1 | Press Release dated March 18, 2026 | |
| 99.2 | Earnings Report | |
| 99.3 | Earnings Call Presentation |
SIGNATURES
Pursuant to the requirements of the Securities Exchange Act of 1934, the registrant has duly caused this report to be signed on its behalf by the undersigned, thereunto duly authorized.
| Alvotech | ||
| (Registrant) | ||
| Date: March 19, 2026 | /s/ Tanya Zharov | |
| Tanya Zharov | ||
| General Counsel | ||
EXHIBIT 99.1
Alvotech Q4 2025 and Full Year 2025 Financial Results
A supplemental long‑form earnings release providing additional operational details and business update for Q4 2025 and the full year is available at: https://investors.alvotech.com/earnings-calendar The supplemental document is provided solely for reference and is not part of this SEC Form 6‑K. The Form 6‑K should not be read together with, or construed as referring to, the supplemental long‑form release.
Financial Highlights
Q4 2025 Highlights
- Total revenues1 were $173 million, up 13% Year-on-Year (YoY)
- Adjusted EBITDA1 was $69 million with Gross Margin at 66%
- AVT05 was approved as a biosimilar to Simponi® in the UK and European Economic Area (EEA)
- AVT03 was approved as a biosimilar to Prolia® and Xgeva® in the EEA
- The EMA accepted for review a marketing application for AVT23, referencing Xolair®
- After the end of the quarter, Alvotech entered into supply and commercialization agreements with Sandoz, covering multiple biosimilars candidates in Canada, Australia and New Zealand
FY 2025 Highlights
- Total revenues1 were $593 million, up 21% YoY
- Adjusted EBITDA1 was $137 million, up 27% YoY, with Gross Margin at 61%
- The cash balance on December 31, 2025, was $172 million
- Second biosimilar in the US, Selarsdi™ referencing Stelara® launched by commercial partner Teva
- Three new biosimilars were approved in multiple markets, including the UK, EEA and Japan
- Alvotech acquired Xbrane’s R&D organization in Sweden and Ivers-Lee Group in Switzerland
- The company listed its shares on Nasdaq Stockholm and raised new equity
- Linda Jonsdottir was appointed Chief Financial Officer, Dr. Balaji V. Prasad was appointed Chief Strategy Officer, while Joseph McClellan transitioned into the role of Chief Operating Officer and Anthony Maffia into the role of Chief Regulatory and Quality Officer
Comments by Chairman of the Board and Outgoing CEO, Róbert Wessman:
“Last year we continued to expand our dedicated end-to-end biosimilars platform, advancing our pipeline with the launches of three newly approved biosimilars, expanding our R&D operation and adding a centralized assembly and packaging unit through acquisitions, while also strengthening our global network through new commercial partnerships.
“We now have five approved and on-market biosimilars supported by our global partners which provide Alvotech with commercial reach into 90 countries worldwide. We have an industry leading pipeline of 30 biosimilars in development and continue adding to it at an accelerated pace.
“During the year we further strengthened our financial position, raising close to $300 million from capital markets to support continued investment in our development programs and manufacturing platform. We broadened our investor base through the listing of shares on Nasdaq Stockholm, providing better access to Nordic and European investors.
“At the same time, we addressed the regulatory observations following the FDA inspection of our Reykjavik manufacturing facility and we implemented a comprehensive improvement program. Based on the progress made so far, we expect to resubmit the affected applications to the FDA during the second quarter of 2026. We have addressed regulatory observations before, and we know how to resolve them. Our focus has been on strengthening the operational platform so that we can continue to scale the business globally.
“We have strengthened the leadership team, with Lisa Graver’s appointment as Chief Executive Officer, and all the key management of the company is now located onsite in Iceland. Lisa and I have worked together for over twenty years, and she is ideally positioned to lead the company through this next stage. She knows the company very well, having been a board member since 2022, which gives her a deep understanding of our strategy, our platform and our global partnerships.
“As Executive Chairman of the Board I will continue to be actively engaged in the business, and I am looking forward working closely with Lisa and the leadership team as we continue building Alvotech into a leading biosimilars company.”
Outlook for 2026
Management reaffirms its outlook for 2026. With continued focus on robust cash flow and margin expansion by delivering solid sales growth and driving operational efficiencies across the company, management anticipates total revenues in the range of $650-700 million in 2026, reflecting continued double-digit sales growth. Adjusted EBITDA is expected to increase to $180-220 million, supported by higher volumes of commercialized products and launches of newly approved products in Europe, the UK and Japan.
Alvotech anticipates receiving U.S. approval by late 2026 for four Biologics License Applications from the U.S. Food and Drug Administration, with minimal impact on the topline. The lower end of the revenue range assumes no revenues from new launches into the U.S. market in 2026.
Invitation to Q4 2025 and Full Year 2025 management presentation:
Join us to listen to the live audio webcast at 8:00 AM EST (12:00 GMT, 13:00 CET) on Thursday, March 19, 2026.
The audio webcast will be accessible via the following link:
https://edge.media-server.com/mmc/p/u2p8ged8/
To participate via telephone in the Q&A session, please register using this link to obtain your PIN:
https://register-conf.media-server.com/register/BI1c565f9bbee94c928c676ea73f178077
Presentation slides for the webcast and other materials are available on the company’s website: https://investors.alvotech.com/earnings-calendar
For further information, please contact:
Media – alvotech.media@alvotech.com
Benedikt Stefansson
Sarah MacLeod
Investors - alvotech.ir@alvotech.com
Dr. Balaji V Prasad (US)
Patrik Ling (SE)
Benedikt Stefansson (IS)
The information was submitted for publication through the agency of the contact persons.
Financial calendar:
Annual or interim results will be released on the dates specified below, after the close of U.S. markets. An earnings call is held on the following day, after release of the results. Please note that all dates are subject to change.
| Quarter | Date of release | Date of earnings call |
| Q1 2026 | May 6, 2026 | May 7, 2026 |
| Q2 2026 | August 19, 2026 | August 20, 2026 |
| Q3 2026 | November 11, 2026 | November 12, 2026 |
| Q4 2026 | March 10, 2027 | March 11, 2027 |
About Alvotech
Alvotech is a biotechnology company, founded by Robert Wessman, focused solely on the development and manufacture of biosimilar medicines for patients worldwide. Alvotech seeks to be a global leader in the biosimilar space by delivering high-quality, cost-effective products and services, enabled by a fully integrated approach and broad in-house capabilities. Five biosimilars are already approved and marketed in multiple global markets, including biosimilars to Humira® (adalimumab), Stelara® (ustekinumab), Simponi® (golimumab), Eylea® (aflibercept) and Prolia®/Xgeva® (denosumab). The current development pipeline includes nine disclosed biosimilar candidates aimed at treating autoimmune disorders, eye disorders, osteoporosis, respiratory disease, and cancer. Alvotech has formed a network of strategic commercial partnerships to provide global reach and leverage local expertise in markets that include the United States, Europe, Japan, China, and other Asian countries and large parts of South America, Africa and the Middle East. For more information, please visit https://www.alvotech.com. None of the information on the Alvotech website shall be deemed part of this press release.
For more information, please visit our investor portal, and our website or follow us on social media on LinkedIn, Facebook, Instagram, and YouTube.
Forward Looking Statements
Certain statements in this communication may be considered “forward-looking statements” within the meaning of the Private Securities Litigation Reform Act of 1995, as amended. Forward-looking statements include, for example, Alvotech’s expectations regarding competitive advantages, business prospects and opportunities including pipeline product development, future plans and intentions, regulatory submissions, review and interactions, the potential approval and commercial launch of its product candidates, the timing of regulatory approval, market launches and financial projections. Such forward-looking statements are subject to risks, uncertainties, and other factors which could cause actual results to differ materially from those expressed or implied by such forward-looking statements. These forward-looking statements are based upon estimates and assumptions that, while considered reasonable by Alvotech and its management, are inherently uncertain and are inherently subject to risks, variability, and contingencies, many of which are beyond Alvotech’s control. Factors that may cause actual results to differ materially from current expectations include, but are not limited to factors set forth in the sections entitled “Risk Factors” and “Cautionary Note Regarding Forward-Looking Statements” in documents that Alvotech may from time-to-time file or furnish with the SEC. There may be additional risks that Alvotech does not presently know or that Alvotech currently believes are immaterial that could also cause actual results to differ from those contained in the forward-looking statements. These forward-looking statements are provided for illustrative purposes only and are not intended to serve as, and must not be relied on by an investor as, a guarantee, assurance, prediction or definitive statement of a fact or probability. Alvotech does not undertake any duty to update these forward-looking statements or to inform the recipient of any matters of which any of them becomes aware of which may affect any matter referred to in this communication. Alvotech disclaims any and all liability for any loss or damage (whether foreseeable or not) suffered or incurred by any person or entity as a result of anything contained or omitted from this communication and such liability is expressly disclaimed.
Non IFRS Financial Measures
This Presentation may include projections of certain financial measures not presented in accordance with International Financial Reporting Standards (“IFRS”) including, but not limited to, Adjusted Revenues, EBITDA and certain ratios and other metrics derived therefrom. These non-IFRS financial measures are not measures of financial performance in accordance with IFRS and may exclude items that are significant in understanding and assessing the Company’s financial results. Therefore, these measures should not be considered in isolation or as an alternative to net income, cash flows from operations or other measures of profitability, liquidity or performance under IFRS. You should be aware that the Company’s presentation of these measures may not be comparable to similarly-titled measures used by other companies. The Company believes these non-IFRS measures of financial results provide useful information to management and investors regarding certain financial and business trends relating to the Company’s financial condition and results of operations. The Company believes that the use of these non-IFRS financial measures provide an additional tool for investors to use in evaluating ongoing operating results and trends and in comparing the Company’s financial measures with other similar companies, many of which present similar non-IFRS financial measures to investors. These non-IFRS financial measures are subject to inherent limitations as they reflect the exercise of judgments by management about which expense and income are excluded or included in determining these non-IFRS financial measures. Due to the high variability and difficulty in making accurate forecasts and projections of some of the information excluded from these projected measures, together with some of the excluded information not being ascertainable or accessible, the Company is unable to quantify certain amounts that would be required to be included in the most directly comparable IFRS financial measures without unreasonable effort. Consequently, no disclosure of estimated comparable IFRS measures is included and no reconciliation of the forward-looking non-IFRS financial measures is included. For the same reasons, the Company is unable to address the probable significance of the unavailable information, which could be material to future results.
1 Figures are adjusted to exclude items that are not indicative of our ongoing operating performance. Please see the disclaimer on ‘Non IFRS Financial Measures’ at the end of this press release. As a foreign private issuer, Alvotech is not required to, and does not, prepare or file quarterly financial statements under IFRS or with the SEC. The financial information included in this Form 6-K reflects management’s current estimates and is presented for the purpose of providing an interim business update.
Exhibit 99.2
Supplemental Business Update Q4 and Full - Year 2025 Results This supplemental document provides selected unaudited financial and operational information for the three months ended December 31, 2025. As a foreign private issuer, Alvotech does not prepare or publish quarterly IFRS financial statements. Accordingly, the quarterly information presented herein is supplemental, unaudited, and provided for informational purposes only to assist investors in understanding recent operating trends. All financial information is unaudited unless otherwise stated. 18 March 2026 Earnings Release
Disclaimer 2 constitute an offer to sell, a solicitation of an offer to buy, or a recommendation to purchase any security of Alvotech (the “Company”) to any person in the United States or in any jurisdiction to whom or in which such offer or solicitation is unlawful. Any trademarks, servicemarks, trade names and copyrights of the Company and other property of their respective owners. This Presentation is strictly confidential to the recipient, it is being distributed to a limited range of invited persons solely for their own information, may not be distributed to the press or published, in whole or in part, in any form. Failure to comply with this restriction may constitute a violation of applicable securities laws. This supplemental document does not contain or its product candidates, the timing of regulatory Forward - Looking Statements Certain statements in this communication may be considered “forward - looking statements” within the meaning of the Private Securities Litigation Reform Act of 1995, as amended. Forward - looking statements include, for example, Alvotech’s expectations regarding competitive advantages, business prospects and opportunities including pipeline product development, future plans and intentions, regulatory submissions, review and interactions, the potential approval and commercial launch of approval, market launches and financial projections. Such forward - looking statements are subject to risks, uncertainties, and other factors which could cause actual results to differ materially from those expressed or implied by such forward - looking statements. These forward - looking statements are based upon companies contained in this Presentation are the estimates and assumptions that, while considered reasonable by Alvotech and its management, are inherently uncertain and are inherently subject to risks, variability, and contingencies, many of which are beyond or any other person, and may not be reproduced results to differ materially from current expectations include, but are not limited to factors set forth in the sections entitled “Risk Factors” and “Cautionary Note Regarding Forward - Looking Statements” in documents that Alvotech may from time - to - time file or furnish with the SEC. There may be additional risks that Alvotech does not presently know or that Alvotech currently believes are immaterial that could also cause actual results to differ from those contained in the forward - looking statements. These forward - looking statements are provided for illustrative purposes only and are not intended to serve as, and must not be relied on by an investor as, a guarantee, assurance, prediction or definitive statement of a fact or probability. Alvotech does not undertake any duty to update these forward - looking statements or to inform the recipient of any matters of which any of them becomes aware of which may affect any matter referred to in this communication. Alvotech disclaims any and all liability for any loss or damage (whether foreseeable or not) suffered or incurred by any or omitted from this communication and such liability is expressly disclaimed . Non - IFRS Financial Measures This Presentation may include projections of certain financial measures not presented in Alvotech’s control. Factors that may cause actual accordance with International Financial Reporting Standards (“IFRS”) including, but not limited to, Adjusted EBITDA and certain ratios IFRS financial measures are not measures of financial performance in accordance with IFRS and may exclude items that are significant in understanding and assessing the Company’s financial results. Therefore, these measures should not be considered in isolation or as an alternative to net income, cash flows from operations or other measures of profitability, liquidity or performance under IFRS. You should be aware that the Company’s presentation of these measures may not be comparable to similarly - titled measures used by other companies. The Company believes these non - IFRS measures of financial results provide useful information to management and investors regarding certain financial and business trends relating to the Company’s financial condition and results of operations. The Company believes that the use of these non - IFRS financial measures provide an additional tool for investors to use in evaluating ongoing operating results and trends person or entity as a result of anything contained and in comparing the Company’s financial measures with other similar companies, many of which present similar non - IFRS financial measures to investors. These non - IFRS financial measures are subject to inherent limitations as they reflect the exercise of judgments by management about which expense and income are excluded or included in determining these non - IFRS financial measures. Due to the high variability and difficulty in making accurate and other metrics derived therefrom. These non - forecasts and projections of some of the information excluded from these projected measures, together with some of the excluded information not being ascertainable or accessible, the Company is unable to quantify certain amounts that would be required to be included in the most directly comparable IFRS financial measures without unreasonable effort. Consequently, no disclosure of estimated comparable IFRS measures is included and no reconciliation of the forward - looking non - IFRS financial measures is included. For the same reasons, the Company is unable to address the probable significance of the unavailable information, which could be material to future results.
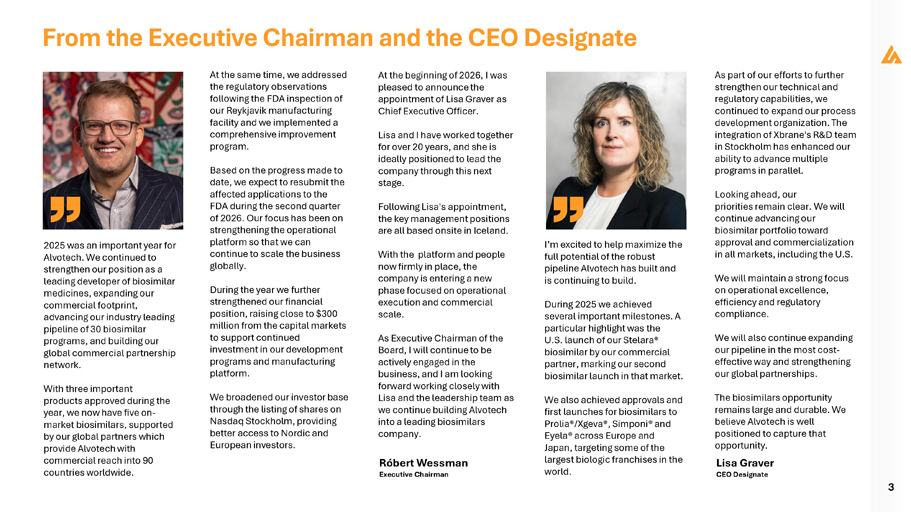
3 The biosimilars opportunity remains large and durable. We believe Alvotech is well positioned to capture that opportunity. Lisa Graver CEO Designate Róbert Wessman Executive Chairman I’m excited to help maximize the full potential of the robust pipeline Alvotech has built and is continuing to build. During 2025 we achieved several important milestones. A particular highlight was the U.S. launch of our Stelara® biosimilar by our commercial partner, marking our second biosimilar launch in that market. We also achieved approvals and first launches for biosimilars to Prolia®/Xgeva®, Simponi® and Eyela® across Europe and Japan, targeting some of the largest biologic franchises in the world. 2025 was an important year for Alvotech. We continued to strengthen our position as a leading developer of biosimilar medicines, expanding our commercial footprint, advancing our industry leading pipeline of 30 biosimilar programs, and building our global commercial partnership network. With three important products approved during the year, we now have five on - market biosimilars, supported by our global partners which provide Alvotech with commercial reach into 90 countries worldwide. At the same time, we addressed the regulatory observations following the FDA inspection of our Reykjavik manufacturing facility and we implemented a comprehensive improvement program. Based on the progress made to date, we expect to resubmit the affected applications to the FDA during the second quarter of 2026. Our focus has been on strengthening the operational platform so that we can continue to scale the business globally. During the year we further strengthened our financial position, raising close to $300 million from the capital markets to support continued investment in our development programs and manufacturing platform. We broadened our investor base through the listing of shares on Nasdaq Stockholm, providing better access to Nordic and European investors. At the beginning of 2026, I was pleased to announce the appointment of Lisa Graver as Chief Executive Officer. Lisa and I have worked together for over 20 years, and she is ideally positioned to lead the company through this next stage. Following Lisa's appointment, the key management positions are all based onsite in Iceland. With the platform and people now firmly in place, the company is entering a new phase focused on operational execution and commercial scale. As Executive Chairman of the Board, I will continue to be actively engaged in the business, and I am looking forward working closely with Lisa and the leadership team as we continue building Alvotech into a leading biosimilars company. As part of our efforts to further strengthen our technical and regulatory capabilities, we continued to expand our process development organization. The integration of Xbrane's R&D team in Stockholm has enhanced our ability to advance multiple programs in parallel. Looking ahead, our priorities remain clear. We will continue advancing our biosimilar portfolio toward approval and commercialization in all markets, including the U.S. We will maintain a strong focus on operational excellence, efficiency and regulatory compliance. We will also continue expanding our pipeline in the most cost - effective way and strengthening our global partnerships. From the Executive Chairman and the CEO Designate
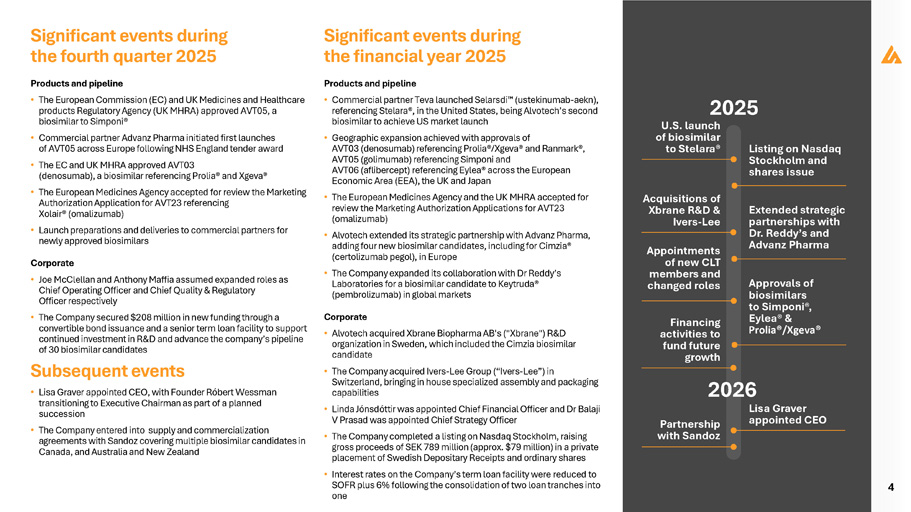
4 Significant events during the fourth quarter 2025 Products and pipeline • The European Commission (EC) and UK Medicines and Healthcare products Regulatory Agency (UK MHRA) approved AVT05, a biosimilar to Simponi® • Commercial partner Advanz Pharma initiated first launches of AVT05 across Europe following NHS England tender award • The EC and UK MHRA approved AVT03 (denosumab), a biosimilar referencing Prolia® and Xgeva® • The European Medicines Agency accepted for review the Marketing Authorization Application for AVT23 referencing Xolair® (omalizumab) • Launch preparations and deliveries to commercial partners for newly approved biosimilars Corporate • Joe McClellan and Anthony Maffia assumed expanded roles as Chief Operating Officer and Chief Quality & Regulatory Officer respectively • The Company secured $208 million in new funding through a convertible bond issuance and a senior term loan facility to support continued investment in R&D and advance the company’s pipeline of 30 biosimilar candidates Subsequent events • Lisa Graver appointed CEO, with Founder Róbert Wessman transitioning to Executive Chairman as part of a planned succession • The Company entered into supply and commercialization agreements with Sandoz covering multiple biosimilar candidates in Canada, and Australia and New Zealand Significant events during the financial year 2025 Products and pipeline • Commercial partner Teva launched Selarsdi (ustekinumab - aekn), referencing Stelara®, in the United States, being Alvotech’s second biosimilar to achieve US market launch • Geographic expansion achieved with approvals of AVT03 (denosumab) referencing Prolia®/Xgeva® and Ranmark®, AVT05 (golimumab) referencing Simponi and AVT06 (aflibercept) referencing Eylea® across the European Economic Area (EEA), the UK and Japan • The European Medicines Agency and the UK MHRA accepted for review the Marketing Authorization Applications for AVT23 (omalizumab) • Alvotech extended its strategic partnership with Advanz Pharma, adding four new biosimilar candidates, including for Cimzia® (certolizumab pegol), in Europe • The Company expanded its collaboration with Dr Reddy’s Laboratories for a biosimilar candidate to Keytruda® (pembrolizumab) in global markets Corporate • Alvotech acquired Xbrane Biopharma AB's ("Xbrane") R&D organization in Sweden, which included the Cimzia biosimilar candidate • The Company acquired Ivers - Lee Group (“Ivers - Lee”) in Switzerland, bringing in house specialized assembly and packaging capabilities • Linda Jónsdóttir was appointed Chief Financial Officer and Dr Balaji V Prasad was appointed Chief Strategy Officer • The Company completed a listing on Nasdaq Stockholm, raising gross proceeds of SEK 789 million (approx. $79 million) in a private placement of Swedish Depositary Receipts and ordinary shares • Interest rates on the Company’s term loan facility were reduced to SOFR plus 6% following the consolidation of two loan tranches into one 2025 Lisa Graver appointed CEO Financing activities to fund future growth U.S. launch of biosimilar to Stelara® Appointments of new CLT members and changed roles Listing on Nasdaq Stockholm and shares issue Acquisitions of Xbrane R&D & Ivers - Lee Extended strategic partnerships with Dr. Reddy’s and Advanz Pharma Approvals of biosimilars to Simponi®, Eylea® & Prolia®/Xgeva® 2026 Partnership with Sandoz
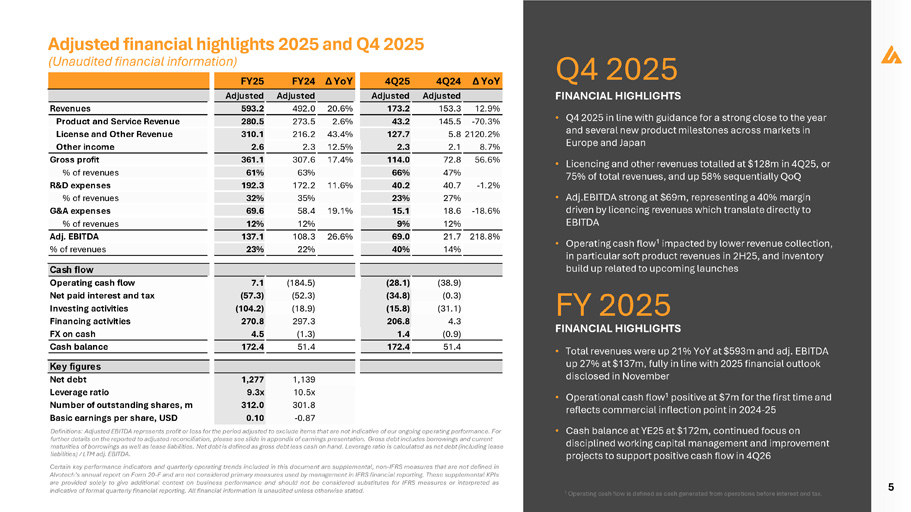
5 Adjusted financial highlights 2025 and Q4 2025 Q4 2025 FINANCIAL HIGHLIGHTS FY 2025 FINANCIAL HIGHLIGHTS • Q4 2025 in line with guidance for a strong close to the year and several new product milestones across markets in Europe and Japan • Licencing and other revenues totalled at $128m in 4Q25, or 75% of total revenues, and up 58% sequentially QoQ • Adj . EBITDA strong at $ 69 m, representing a 40 % margin driven by licencing revenues which translate directly to EBITDA • Operating cash flow 1 impacted by lower revenue collection, in particular soft product revenues in 2H25, and inventory build up related to upcoming launches • Total revenues were up 21% YoY at $593m and adj. EBITDA up 27% at $137m, fully in line with 2025 financial outlook disclosed in November • Operational cash flow 1 positive at $7m for the first time and reflects commercial inflection point in 2024 - 25 • Cash balance at YE25 at $172m, continued focus on disciplined working capital management and improvement projects to support positive cash flow in 4Q26 Definitions: Adjusted EBITDA represents profit or loss for the period adjusted to exclude items that are not indicative of our ongoing operating performance. For further details on the reported to adjusted reconciliation, please see slide in appendix of earnings presentation. Gross debt includes borrowings and current maturities of borrowings as well as lease liabilities. Net debt is defined as gross debt less cash on hand. Leverage ratio is calculated as net debt (including lease liabilities) / LTM adj. EBITDA. Certain key performance indicators and quarterly operating trends included in this document are supplemental, non - IFRS measures that are not defined in Alvotech’s annual report on Form 20 - F and are not considered primary measures used by management in IFRS financial reporting . These supplemental KPIs are provided solely to give additional context on business performance and should not be considered substitutes for IFRS measures or interpreted as indicative of formal quarterly financial reporting . All financial information is unaudited unless otherwise stated . 1 Operating cash flow is defined as cash generated from operations before interest and tax. (184.5) 7.1 (52.3) (57.3) (18.9) (104.2) 297.3 270.8 (1.3) 4.5 51.4 172.4 (38.9) (28.1) (0.3) (34.8) (31.1) (15.8) 4.3 206.8 (0.9) 1.4 51.4 172.4 1,139 1,277 10.5x 9.3x 301.8 312.0 - 0.87 0.10 4Q24 Δ YoY 12.9% Adjusted Adjusted Adjusted Adjusted 593.2 492.0 20.6% 173.2 153.3 280.5 273.5 2.6% 43.2 145.5 - 70.3% 310.1 2.6 216.2 43.4% 2.3 12.5% 361.1 307.6 17.4% 61% 63% 192.3 172.2 11.6% 32% 35% 69.6 58.4 19.1% 12% 12% 137.1 108.3 26.6% Revenues Product and Service Revenue License and Other Revenue Other income Gross profit % of revenues R&D expenses % of revenues G&A expenses % of revenues Adj. EBITDA % of revenues 23% 22% 127.7 5.8 2120.2% 2.3 2.1 8.7% 114.0 72.8 56.6% 66% 47% 40.2 40.7 - 1.2% 23% 27% 15.1 18.6 - 18.6% 9% 12% 69.0 21.7 218.8% 40% 14% Cash flow Operating cash flow Net paid interest and tax Investing activities Financing activities FX on cash Cash balance Key figures Net debt Leverage ratio Number of outstanding shares, m Basic earnings per share, USD (Unaudited financial information) FY25 FY24 Δ YoY 4Q25
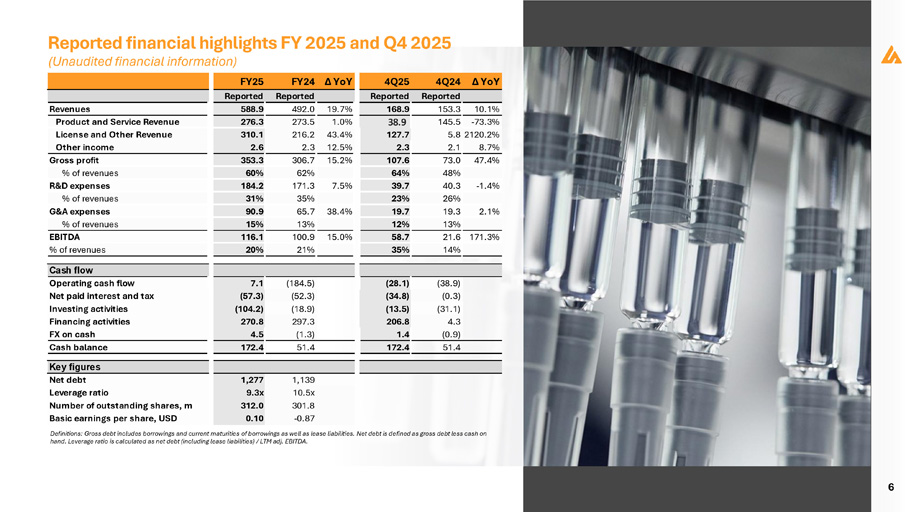
6 Definitions: Gross debt includes borrowings and current maturities of borrowings as well as lease liabilities. Net debt is defined as gross debt less cash on hand. Leverage ratio is calculated as net debt (including lease liabilities) / LTM adj. EBITDA. Revenues Product and Service Revenue License and Other Revenue Other income Gross profit % of revenues R&D expenses % of revenues G&A expenses % of revenues EBITDA % of revenues FY25 FY24 Δ YoY Reported Reported 19.7% 492.0 588.9 1.0% 273.5 276.3 216.2 43.4% 2.3 12.5% 310.1 2.6 15.2% 306.7 353.3 62% 60% 7.5% 171.3 184.2 35% 31% 38.4% 65.7 90.9 13% 15% 15.0% 100.9 116.1 21% 20% Δ YoY 4Q24 4Q25 Reported Reported 10.1% 153.3 168.9 - 73.3% 145.5 38.9 5.8 2120.2% 127.7 8.7% 2.1 2.3 47.4% 73.0 107.6 48% 64% - 1.4% 40.3 39.7 26% 23% 2.1% 19.3 19.7 13% 12% 171.3% 21.6 58.7 14% 35% (184.5) 7.1 (52.3) (57.3) (18.9) (104.2) 297.3 270.8 (1.3) 4.5 51.4 172.4 (38.9) (28.1) (0.3) (34.8) (31.1) (13.5) 4.3 206.8 (0.9) 1.4 51.4 172.4 Cash flow Operating cash flow Net paid interest and tax Investing activities Financing activities FX on cash Cash balance Key figures 1,139 10.5x 301.8 1,277 9.3x 312.0 Net debt Leverage ratio Number of outstanding shares, m - 0.87 0.10 Basic earnings per share, USD Reported financial highlights FY 2025 and Q4 2025 (Unaudited financial information)
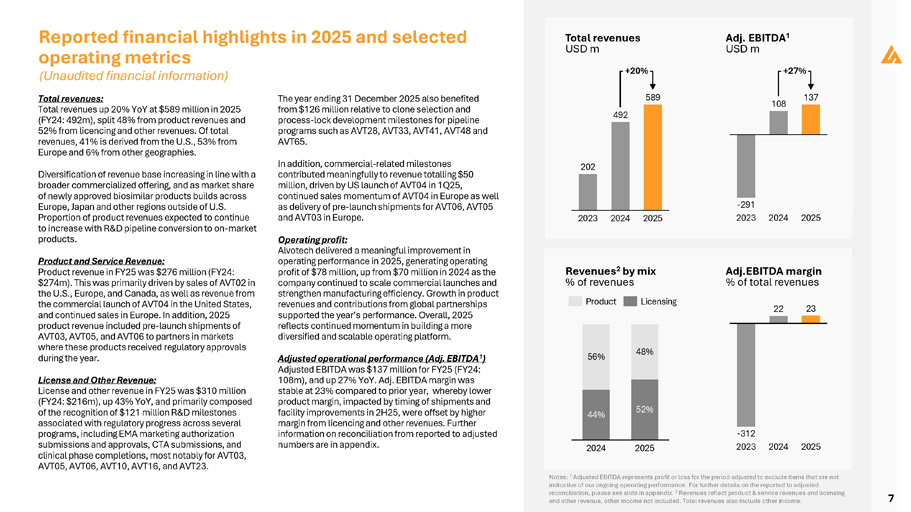
7 Total revenues: Total revenues up 20% YoY at $589 million in 2025 (FY24: 492m), split 48% from product revenues and 52% from licencing and other revenues. Of total revenues, 41% is derived from the U.S., 53% from Europe and 6% from other geographies. Diversification of revenue base increasing in line with a broader commercialized offering, and as market share of newly approved biosimilar products builds across Europe, Japan and other regions outside of U.S. Proportion of product revenues expected to continue to increase with R&D pipeline conversion to on - market products. Product and Service Revenue: Product revenue in FY25 was $276 million (FY24: $274m). This was primarily driven by sales of AVT02 in the U.S., Europe, and Canada, as well as revenue from the commercial launch of AVT04 in the United States, and continued sales in Europe. In addition, 2025 product revenue included pre - launch shipments of AVT03, AVT05, and AVT06 to partners in markets where these products received regulatory approvals during the year. License and Other Revenue: License and other revenue in FY25 was $310 million (FY24: $216m), up 43% YoY, and primarily composed of the recognition of $121 million R&D milestones associated with regulatory progress across several programs, including EMA marketing authorization submissions and approvals, CTA submissions, and clinical phase completions, most notably for AVT03, AVT05, AVT06, AVT10, AVT16, and AVT23. The year ending 31 December 2025 also benefited from $126 million relative to clone selection and process - lock development milestones for pipeline programs such as AVT28, AVT33, AVT41, AVT48 and AVT65. In addition, commercial - related milestones contributed meaningfully to revenue totalling $50 million, driven by US launch of AVT04 in 1Q25, continued sales momentum of AVT04 in Europe as well as delivery of pre - launch shipments for AVT06, AVT05 and AVT03 in Europe. Operating profit: Alvotech delivered a meaningful improvement in operating performance in 2025, generating operating profit of $78 million, up from $70 million in 2024 as the company continued to scale commercial launches and strengthen manufacturing efficiency. Growth in product revenues and contributions from global partnerships supported the year’s performance . Overall, 2025 reflects continued momentum in building a more diversified and scalable operating platform . Adjusted operational performance (Adj. EBITDA 1 ) Adjusted EBITDA was $137 million for FY25 (FY24: 108m), and up 27% YoY. Adj. EBITDA margin was stable at 23% compared to prior year, whereby lower product margin, impacted by timing of shipments and facility improvements in 2H25, were offset by higher margin from licencing and other revenues. Further information on reconciliation from reported to adjusted numbers are in appendix. Reported financial highlights in 2025 and selected operating metrics 202 492 589 2023 2024 2025 Total revenues USD m +20% 108 137 - 291 2023 2024 2025 Adj. EBITDA 1 USD m +27% - 312 2023 2024 2025 44% 52% 56% 48% 2024 2025 Product Licensing Revenues 2 by mix % of revenues Adj.EBITDA margin % of total revenues 22 23 Notes: 1 Adjusted EBITDA represents profit or loss for the period adjusted to exclude items that are not indicative of our ongoing operating performance. For further details on the reported to adjusted reconciliation, please see slide in appendix. 2 Revenues reflect product & service revenues and licensing and other revenue, other income not included. Total revenues also include other income. (Unaudited financial information)
8 Cost of product and service revenue (COGS): Cost of product revenue was $236 million in FY25 (FY24: $185m). This increase was primarily driven by increased overall volume, product mix and non - recurring manufacturing costs which increased overall cost levels without a corresponding increase in revenue. Research and development (R&D) expenses: R&D expenses were $184 million for FY25 (FY24: $171m). The increase was primarily driven by an increase of $47 million in direct program expenses mainly due to AVT16 and AVT29 programs that are advancing through clinical phase and overall higher other R&D expenses for $29 million due to the advancement of other programs and FDA readiness costs during 2H25. This was partially offset by a decrease of $63 million related to programs which reached commercialization (i.e., AVT04, AVT03, AVT05, and AVT06). General and administrative (G&A) expenses: G&A expenses were $91 million for FY25 (FY24: $66m). The increase was mainly driven by $22 million in higher legal, facility and external service costs, as well as $4 million increase in transaction costs mainly related to the Swedish offering. CAPEX and M&A activities: In 2025, Alvotech strengthened its development capabilities and supply chain through two targeted acquisitions. In June, the Company acquired Xbrane Biopharma’s R&D operations, including the XB003 biosimilar candidate referencing Cimzia, for approximately $29 million. In July, Alvotech expanded its European manufacturing and clinical supply footprint with the acquisition of Ivers - Lee, a Switzerland - and Germany - based provider of pharmaceutical packaging and clinical supply services, for a purchase price of $19 million, resulting in an $8 million gain, primarily driven by the uplift on acquired real estate. These acquisitions support Alvotech’s long - term biosimilar pipeline and enhance its integrated global supply network. Exchange rate differences: Exchange rate differences resulted in a loss of $17 million for FY25 (FY24: gain of $8 m). The change was primarily driven by the movements in the exchange rate of foreign currencies, predominantly Icelandic krona and euros. Income tax: Income tax expense was $108 million for FY25 (FY24: income tax expense of $14 million). The change is mainly driven by a $130 million deferred tax charge due to the derecognition of deferred tax assets related to Icelandic tax losses. This was partly offset by a $37 million FX - related deferred tax benefit and a modest increase in deferred tax expense from operating results. Profit / (loss) for the Period: The Company reported a net profit for the period of $28 million in 2025, compared to a net loss of $232 million in 2024, reflecting stronger overall performance driven by higher revenues and a more favorable finance result. Profit was partially offset by higher income tax expense due to the derecognition of deferred tax assets related to Icelandic tax losses.
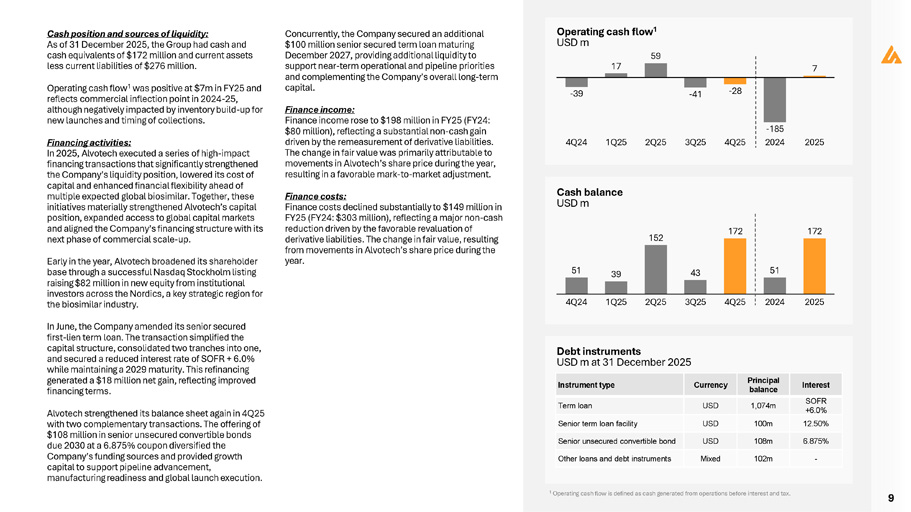
9 Cash position and sources of liquidity: As of 31 December 2025, the Group had cash and cash equivalents of $172 million and current assets less current liabilities of $276 million. Operating cash flow 1 was positive at $7m in FY25 and reflects commercial inflection point in 2024 - 25, although negatively impacted by inventory build - up for new launches and timing of collections. Financing activities: In 2025, Alvotech executed a series of high - impact financing transactions that significantly strengthened the Company’s liquidity position, lowered its cost of capital and enhanced financial flexibility ahead of multiple expected global biosimilar. Together, these initiatives materially strengthened Alvotech’s capital position, expanded access to global capital markets and aligned the Company’s financing structure with its next phase of commercial scale - up. Early in the year, Alvotech broadened its shareholder base through a successful Nasdaq Stockholm listing raising $82 million in new equity from institutional investors across the Nordics, a key strategic region for the biosimilar industry. In June, the Company amended its senior secured first - lien term loan. The transaction simplified the capital structure, consolidated two tranches into one, and secured a reduced interest rate of SOFR + 6.0% while maintaining a 2029 maturity. This refinancing generated a $18 million net gain, reflecting improved financing terms. Alvotech strengthened its balance sheet again in 4Q25 with two complementary transactions. The offering of $108 million in senior unsecured convertible bonds due 2030 at a 6.875% coupon diversified the Company’s funding sources and provided growth capital to support pipeline advancement, manufacturing readiness and global launch execution. Concurrently, the Company secured an additional $100 million senior secured term loan maturing December 2027, providing additional liquidity to support near - term operational and pipeline priorities and complementing the Company’s overall long - term capital. Finance income: Finance income rose to $198 million in FY25 (FY24: $80 million), reflecting a substantial non - cash gain driven by the remeasurement of derivative liabilities. The change in fair value was primarily attributable to movements in Alvotech’s share price during the year, resulting in a favorable mark - to - market adjustment. Finance costs: Finance costs declined substantially to $149 million in FY25 (FY24: $303 million), reflecting a major non - cash reduction driven by the favorable revaluation of derivative liabilities. The change in fair value, resulting from movements in Alvotech’s share price during the year. Cash balance USD m Debt instruments USD m at 31 December 2025 - 39 Operating cash flow 1 USD m 59 17 - 41 - 28 7 - 185 4Q24 1Q25 2Q25 3Q25 4Q25 2024 2025 51 39 152 43 172 51 172 4Q24 1Q25 2Q25 3Q25 4Q25 2024 2025 Interest Principal balance Currency Instrument type SOFR +6.0% 1,074m USD Term loan 12.50% 100m USD Senior term loan facility 6.875% 108m USD Senior unsecured convertible bond - 102m Mixed Other loans and debt instruments 1 Operating cash flow is defined as cash generated from operations before interest and tax.
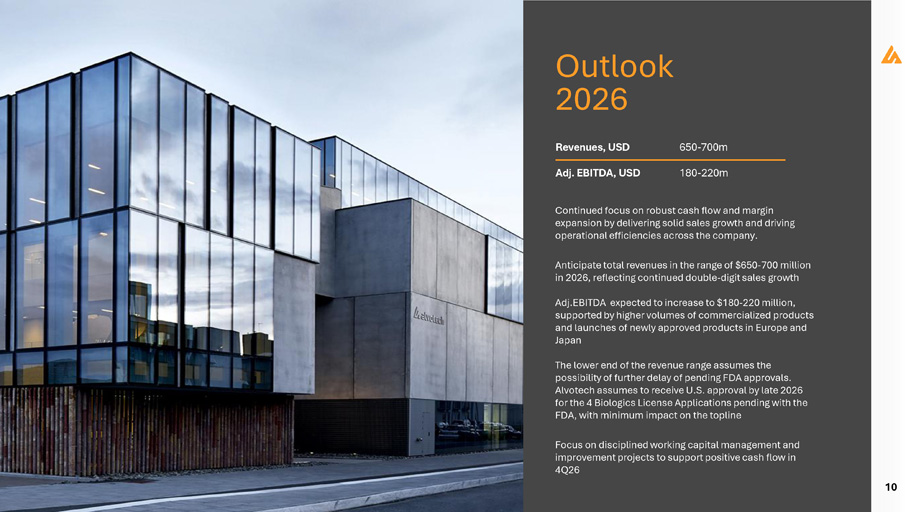
10 Outlook 2026 Continued focus on robust cash flow and margin expansion by delivering solid sales growth and driving operational efficiencies across the company. Anticipate total revenues in the range of $650 - 700 million in 2026, reflecting continued double - digit sales growth Adj.EBITDA expected to increase to $180 - 220 million, supported by higher volumes of commercialized products and launches of newly approved products in Europe and Japan The lower end of the revenue range assumes the possibility of further delay of pending FDA approvals. Alvotech assumes to receive U.S. approval by late 2026 for the 4 Biologics License Applications pending with the FDA, with minimum impact on the topline Focus on disciplined working capital management and improvement projects to support positive cash flow in 4Q26 650 - 700m Revenues, USD 180 - 220m Adj. EBITDA, USD
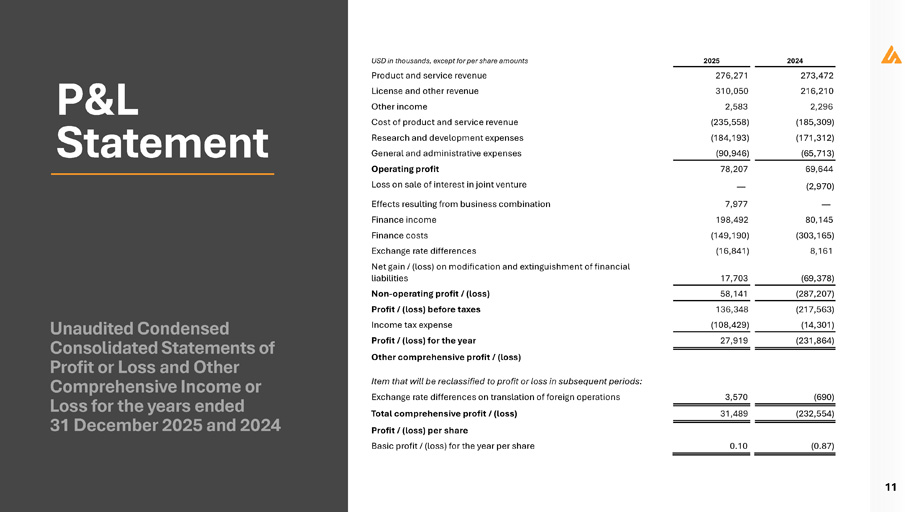
Unaudited Condensed Consolidated Statements of Profit or Loss and Other Comprehensive Income or Loss for the years ended 31 December 2025 and 2024 11 P&L Statement 2024 2025 USD in thousands, except for per share amounts 273,472 276,271 Product and service revenue 216,210 310,050 License and other revenue 2,296 2,583 Other income (185,309) (235,558) Cost of product and service revenue (171,312) (184,193) Research and development expenses (65,713) (90,946) General and administrative expenses 69,644 78,207 Operating profit (2,970) — Loss on sale of interest in joint venture — 7,977 Effects resulting from business combination 80,145 198,492 Finance income (303,165) (149,190) Finance costs 8,161 (16,841) Exchange rate differences (69,378) 17,703 Net gain / (loss) on modification and extinguishment of financial liabilities (287,207) 58,141 Non - operating profit / (loss) (217,563) 136,348 Profit / (loss) before taxes (14,301) (108,429) Income tax expense (231,864) 27,919 Profit / (loss) for the year Other comprehensive profit / (loss) Item that will be reclassified to profit or loss in subsequent periods: (690) 3,570 Exchange rate differences on translation of foreign operations (232,554) 31,489 Total comprehensive profit / (loss) Profit / (loss) per share (0.87) 0.10 Basic profit / (loss) for the year per share
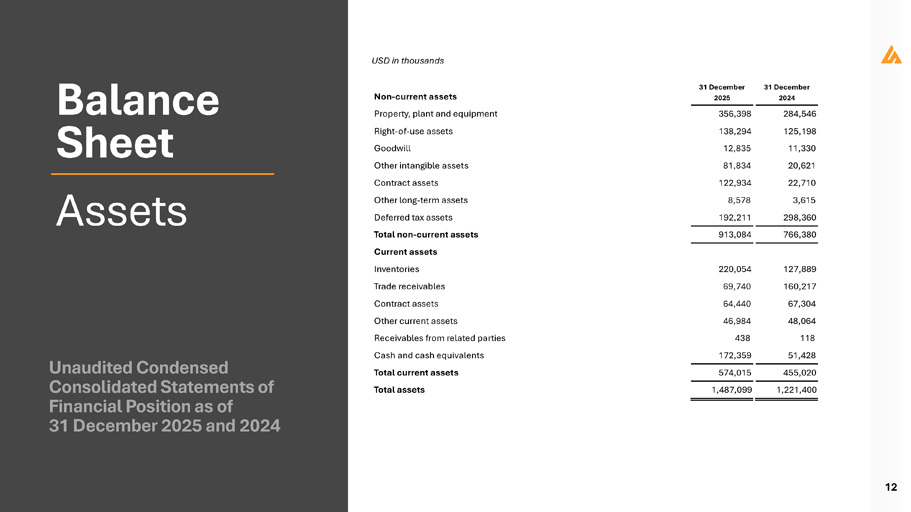
Unaudited Condensed Consolidated Statements of Financial Position as of 31 December 2025 and 2024 12 Balance Sheet Assets USD in thousands Non - current assets 31 December 2025 31 December 2024 284,546 356,398 Property, plant and equipment 125,198 138,294 Right - of - use assets 11,330 12,835 Goodwill 20,621 81,834 Other intangible assets 22,710 122,934 Contract assets 3,615 8,578 Other long - term assets 298,360 192,211 Deferred tax assets 766,380 913,084 Total non - current assets 127,889 220,054 Current assets Inventories 160,217 69,740 Trade receivables 67,304 64,440 Contract assets 48,064 46,984 Other current assets 118 438 Receivables from related parties 51,428 172,359 Cash and cash equivalents 455,020 574,015 Total current assets 1,221,400 1,487,099 Total assets
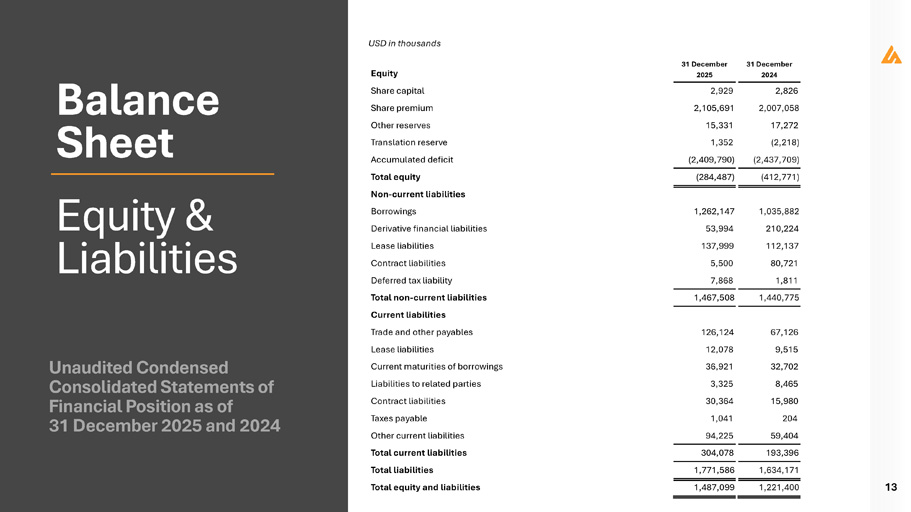
Unaudited Condensed Consolidated Statements of Financial Position as of 31 December 2025 and 2024 2,826 2,929 Share capital 2,007,058 2,105,691 Share premium 17,272 15,331 Other reserves (2,218) 1,352 Translation reserve (2,437,709) (2,409,790) Accumulated deficit (412,771) (284,487) Total equity 1,035,882 1,262,147 Non - current liabilities Borrowings 210,224 53,994 Derivative financial liabilities 112,137 137,999 Lease liabilities 80,721 5,500 Contract liabilities 1,811 7,868 Deferred tax liability 1,440,775 1,467,508 Total non - current liabilities 67,126 126,124 Current liabilities Trade and other payables 9,515 12,078 Lease liabilities 32,702 36,921 Current maturities of borrowings 8,465 3,325 Liabilities to related parties 15,980 30,364 Contract liabilities 204 1,041 Taxes payable 59,404 94,225 Other current liabilities 193,396 304,078 Total current liabilities 1,634,171 1,771,586 Total liabilities 13 1,221,400 1,487,099 Total equity and liabilities Balance Sheet Equity & Liabilities USD in thousands Equity 31 December 2025 31 December 2024
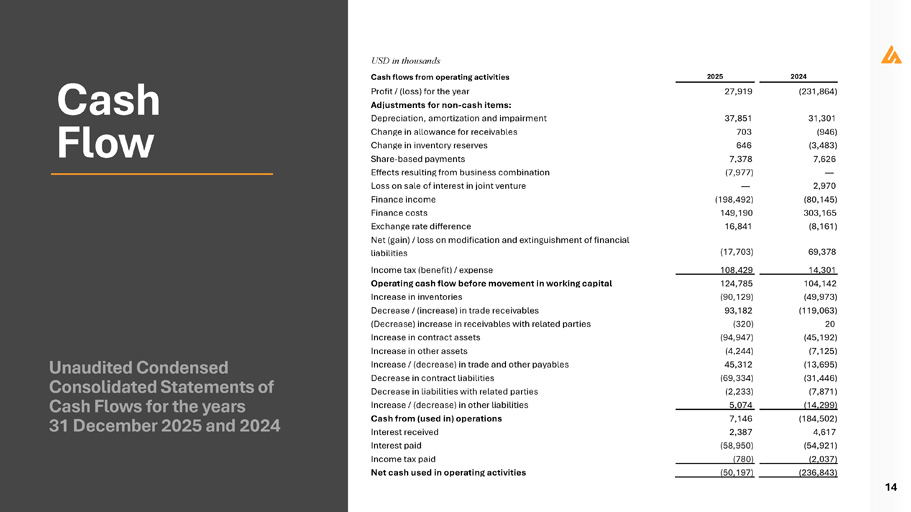
Unaudited Condensed Consolidated Statements of Cash Flows for the years 31 December 2025 and 2024 14 Cash Flow USD in thousands 2024 2025 Cash flows from operating activities (231,864) 27,919 Profit / (loss) for the year Adjustments for non - cash items: 31,301 37,851 Depreciation, amortization and impairment (946) 703 Change in allowance for receivables (3,483) 646 Change in inventory reserves 7,626 7,378 Share - based payments — (7,977) Effects resulting from business combination 2,970 — Loss on sale of interest in joint venture (80,145) (198,492) Finance income 303,165 149,190 Finance costs (8,161) 16,841 Exchange rate difference 69,378 (17,703) Net (gain) / loss on modification and extinguishment of financial liabilities 14,301 108,429 Income tax (benefit) / expense 104,142 124,785 Operating cash flow before movement in working capital (49,973) (90,129) Increase in inventories (119,063) 93,182 Decrease / (increase) in trade receivables 20 (320) (Decrease) increase in receivables with related parties (45,192) (94,947) Increase in contract assets (7,125) (4,244) Increase in other assets (13,695) 45,312 Increase / (decrease) in trade and other payables (31,446) (69,334) Decrease in contract liabilities (7,871) (2,233) Decrease in liabilities with related parties (14,299) 5,074 Increase / (decrease) in other liabilities (184,502) 7,146 Cash from (used in) operations 4,617 2,387 Interest received (54,921) (58,950) Interest paid (2,037) (780) Income tax paid (236,843) (50,197) Net cash used in operating activities
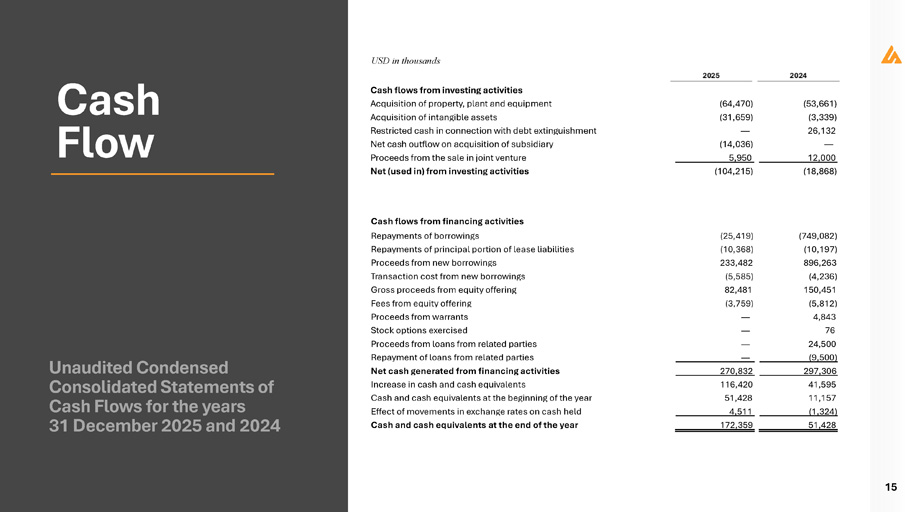
Unaudited Condensed Consolidated Statements of Cash Flows for the years 31 December 2025 and 2024 15 Cash Flow USD in thousands Cash flows from investing activities (53,661) (64,470) Acquisition of property, plant and equipment (3,339) (31,659) Acquisition of intangible assets 26,132 — Restricted cash in connection with debt extinguishment — (14,036) Net cash outflow on acquisition of subsidiary 12,000 5,950 Proceeds from the sale in joint venture (18,868) (104,215) Net (used in) from investing activities Cash flows from financing activities (749,082) (25,419) Repayments of borrowings (10,197) (10,368) Repayments of principal portion of lease liabilities 896,263 233,482 Proceeds from new borrowings (4,236) (5,585) Transaction cost from new borrowings 150,451 82,481 Gross proceeds from equity offering (5,812) (3,759) Fees from equity offering 4,843 — Proceeds from warrants 76 — Stock options exercised 24,500 — Proceeds from loans from related parties (9,500) — Repayment of loans from related parties 297,306 270,832 Net cash generated from financing activities 41,595 116,420 Increase in cash and cash equivalents 11,157 51,428 Cash and cash equivalents at the beginning of the year (1,324) 4,511 Effect of movements in exchange rates on cash held 51,428 172,359 Cash and cash equivalents at the end of the year
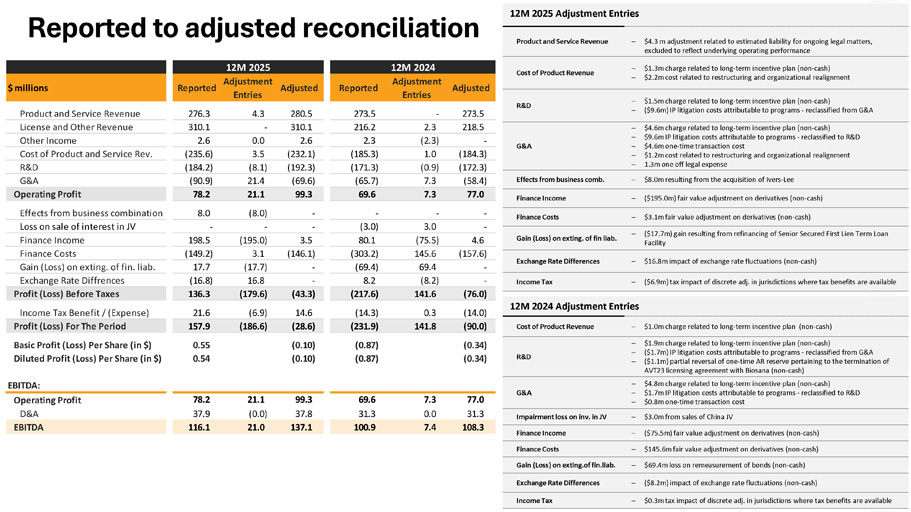
Reported to adjusted reconciliation 12M 2025 Adjustment Entries Product and Service Revenue $4.3 m adjustment related to estimated liability for ongoing legal matters, excluded to reflect underlying operating performance $1.3m charge related to long - term incentive plan (non - cash) $2.2m cost related to restructuring and organizational realignment $1.5m charge related to long - term incentive plan (non - cash) ($9.6m) IP litigation costs attributable to programs - reclassified from G&A $4.6m charge related to long - term incentive plan (non - cash) $9.6m IP litigation costs attributable to programs - reclassified to R&D $4.6m one - time transaction cost $1.2m cost related to restructuring and organizational realignment 1.3m one off legal expense $8.0m resulting from the acquisition of Ivers - Lee Finance Income ($195.0m) fair value adjustment on derivatives (non - cash) Finance Costs $3.1m fair value adjustment on derivatives (non - cash) Gain (Loss) on exting. of fin liab. ($17.7m) gain resulting from refinancing of Senior Secured First Lien Term Loan Facility Exchange Rate Differences $16.8m impact of exchange rate fluctuations (non - cash) ($6.9m) tax impact of discrete adj. in jurisdictions where tax benefits are available Income Tax 12M 2024 Adjustment Entries Cost of Product Revenue $1.0m charge related to long - term incentive plan (non - cash) R&D $1.9m charge related to long - term incentive plan (non - cash) ($1.7m) IP litigation costs attributable to programs - reclassified from G&A ($1.1m) partial reversal of one - time AR reserve pertaining to the termination of AVT23 licensing agreement with Biosana (non - cash) G&A $4.8m charge related to long - term incentive plan (non - cash) $1.7m IP litigation costs attributable to programs - reclassified to R&D $0.8m one - time transaction cost Impairment loss on inv. in JV $3.0m from sales of China JV Finance Income ($75.5m) fair value adjustment on derivatives (non - cash) Finance Costs $145.6m fair value adjustment on derivatives (non - cash) Gain (Loss) on exting.of fin.liab. $69.4m loss on remeasurement of bonds (non - cash) Exchange Rate Differences ($8.2m) impact of exchange rate fluctuations (non - cash) Income Tax $0.3m tax impact of discrete adj. in jurisdictions where tax benefits are available Cost of Product Revenue R&D Adjusted 273.5 12M 2024 Adjustment Entries - Reported 273.5 Adjusted 280.5 12M 2025 Adjustment Entries 4.3 Reported 276.3 $ millions Product and Service Revenue 218.5 2.3 216.2 310.1 - 310.1 License and Other Revenue G&A - (2.3) 2.3 2.6 0.0 2.6 Other Income (184.3) 1.0 (185.3) (232.1) 3.5 (235.6) Cost of Product and Service Rev. (172.3) (0.9) (171.3) (192.3) (8.1) (184.2) R&D Effects from business comb. (58.4) 7.3 (65.7) (69.6) 21.4 (90.9) G&A Operating Profit 78.2 21.1 99.3 69.6 7.3 77.0 Effects from business combination 8.0 (8.0) - - - - Loss on sale of interest in JV - - - (3.0) 3.0 - Finance Income 198.5 (195.0) 3.5 80.1 (75.5) 4.6 Finance Costs (149.2) 3.1 (146.1) (303.2) 145.6 (157.6) Gain (Loss) on exting. of fin. liab. 17.7 (17.7) - (69.4) 69.4 - Exchange Rate Diffrences (16.8) 16.8 - 8.2 (8.2) - Profit (Loss) Before Taxes 136.3 (179.6) (43.3) (217.6) 141.6 (76.0) Income Tax Benefit / (Expense) 21.6 (6.9) 14.6 (14.3) 0.3 (14.0) Profit (Loss) For The Period 157.9 (186.6) (28.6) (231.9) 141.8 (90.0) Basic Profit (Loss) Per Share (in $) Diluted Profit (Loss) Per Share (in $) 0.55 0.54 (0.10) (0.10) (0.87) (0.87) (0.34) (0.34) EBITDA: Operating Profit D&A 78.2 37.9 21.1 (0.0) 99.3 37.8 69.6 31.3 7.3 0.0 77.0 31.3 EBITDA 116.1 21.0 137.1 100.9 7.4 108.3
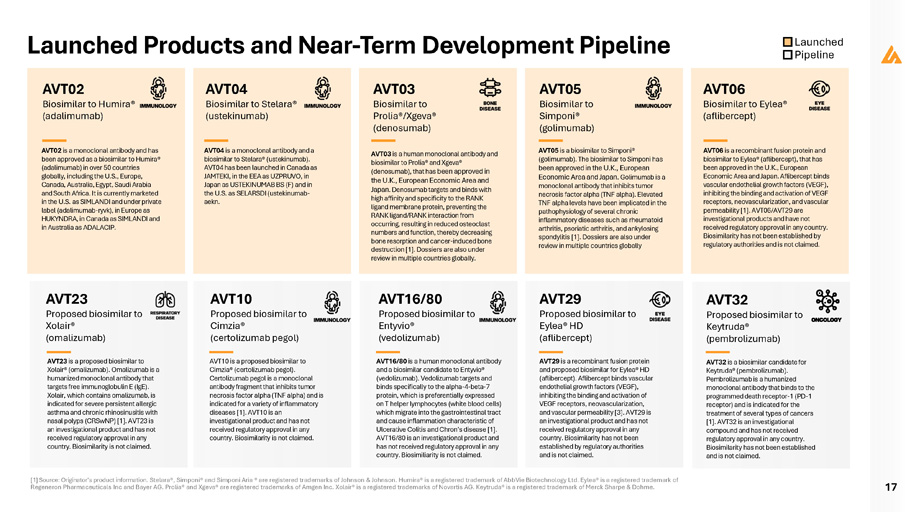
17 AVT02 Biosimilar to Humira® (adalimumab) AVT02 is a monoclonal antibody and has been approved as a biosimilar to Humira® (adalimumab) in over 50 countries globally, including the U.S., Europe, Canada, Australia, Egypt, Saudi Arabia and South Africa. It is currently marketed in the U.S. as SIMLANDI and under private label (adalimumab - ryvk), in Europe as HUKYNDRA, in Canada as SIMLANDI and in Australia as ADALACIP. AVT03 Biosimilar to Prolia®/Xgeva® (denosumab) AVT03 is a human monoclonal antibody and biosimilar to Prolia® and Xgeva® (denosumab), that has been approved in the U.K., European Economic Area and Japan . Denosumab targets and binds with high affinity and specificity to the RANK ligand membrane protein, preventing the RANK ligand/RANK interaction from occurring, resulting in reduced osteoclast numbers and function, thereby decreasing bone resorption and cancer - induced bone destruction [1]. Dossiers are also under review in multiple countries globally. AVT04 Biosimilar to Stelara® (ustekinumab) AVT04 is a monoclonal antibody and a biosimilar to Stelara® (ustekinumab). AVT04 has been launched in Canada as JAMTEKI, in the EEA as UZPRUVO, in Japan as USTEKINUMAB BS (F) and in the U.S. as SELARSDI (ustekinumab - aekn. AVT05 Biosimilar to Simponi® (golimumab) AVT05 is a biosimilar to Simponi® (golimumab). The biosimilar to Simponi has been approved in the U.K., European Economic Area and Japan. Golimumab is a monoclonal antibody that inhibits tumor necrosis factor alpha (TNF alpha). Elevated TNF alpha levels have been implicated in the pathophysiology of several chronic inflammatory diseases such as rheumatoid arthritis, psoriatic arthritis, and ankylosing spondylitis [1]. Dossiers are also under review in multiple countries globally AVT10 Proposed biosimilar to Cimzia® (certolizumab pegol) AVT10 is a proposed biosimilar to Cimzia® (certolizumab pegol). Certolizumab pegol is a monoclonal antibody fragment that inhibits tumor necrosis factor alpha (TNF alpha) and is indicated for a variety of inflammatory diseases [1]. AVT10 is an investigational product and has not received regulatory approval in any country. Biosimilarity is not claimed. AVT16/80 Proposed biosimilar to Entyvio® (vedolizumab) AVT16/80 is a human monoclonal antibody and a biosimilar candidate to Entyvio® (vedolizumab). Vedolizumab targets and binds specifically to the alpha - 4 - beta - 7 protein, which is preferentially expressed on T helper lymphocytes (white blood cells) which migrate into the gastrointestinal tract and cause inflammation characteristic of Ulcerative Colitis and Chron’s disease [ 1 ] . AVT 16 / 80 is an investigational product and has not received regulatory approval in any country . Biosimiliarity is not claimed . AVT06 Biosimilar to Eylea® (aflibercept) AVT06 is a recombinant fusion protein and biosimilar to Eylea® (aflibercept), that has been approved in the U.K., European Economic Area and Japan. Aflibercept binds vascular endothelial growth factors (VEGF), inhibiting the binding and activation of VEGF receptors, neovascularization, and vascular permeability [1]. AVT06/AVT29 are investigational products and have not received regulatory approval in any country. Biosimilarity has not been established by regulatory authorities and is not claimed. AVT23 Proposed biosimilar to Xolair® (omalizumab) AVT23 is a proposed biosimilar to Xolair® (omalizumab). Omalizumab is a humanized monoclonal antibody that targets free immunoglobulin E (IgE). Xolair, which contains omalizumab, is indicated for severe persistent allergic asthma and chronic rhinosinusitis with nasal polyps (CRSwNP) [1]. AVT23 is an investigational product and has not received regulatory approval in any country. Biosimilarity is not claimed. [1] Source: Originator’s product information. Stelara®, Simponi® and Simponi Aria ® are registered trademarks of Johnson & Johnson. Humira® is a registered trademark of AbbVie Biotechnology Ltd. Eylea® is a registered trademark of Regeneron Pharmaceuticals Inc and Bayer AG. Prolia® and Xgeva® are registered trademarks of Amgen Inc. Xolair® is a registered trademarks of Novartis AG. Keytruda® is a registered trademark of Merck Sharpe & Dohme. Launched Products and Near - Term Development Pipeline AVT29 Proposed biosimilar to Eylea® HD (aflibercept) AVT29 is a recombinant fusion protein and proposed biosimilar for Eylea® HD (aflibercept). Aflibercept binds vascular endothelial growth factors (VEGF), inhibiting the binding and activation of VEGF receptors, neovascularization, and vascular permeability [3]. AVT29 is an investigational product and has not received regulatory approval in any country. Biosimilarity has not been established by regulatory authorities and is not claimed. AVT32 Proposed biosimilar to Keytruda® (pembrolizumab) AVT32 is a biosimilar candidate for Keytruda® (pembrolizumab). Pembrolizumab is a humanized monoclonal antibody that binds to the programmed death receptor - 1 (PD - 1 receptor) and is indicated for the treatment of several types of cancers [1]. AVT32 is an investigational compound and has not received regulatory approval in any country. Biosimilarity has not been established and is not claimed. Launched Pipeline

Q4 2025 Earnings Release 18 About Alvotech Alvotech is a biotechnology company, founded by Robert Wessman, focused solely on the development and manufacture of biosimilar medicines for patients worldwide. Alvotech seeks to be a global leader in the biosimilar space by delivering high - quality, cost - effective products and services, enabled by a fully integrated approach and broad in - house capabilities. Five biosimilars developed and manufactured by Alvotech are already approved and marketed in multiple global markets, including biosimilars to Humira® (adalimumab), Stelara® (ustekinumab), Simponi® (golimumab), Eylea® (aflibercept) and Prolia®/Xgeva® (denosumab). Our current development pipeline includes disclosed biosimilar candidates aimed at treating a variety of conditions such as autoimmune disorders, eye disorders, osteoporosis, respiratory disease, blood disorders and cancer. Additionally, Alvotech has over twenty early - stage development programs, with cell lines that are ready to move to the stage of process development. Alvotech has formed a network of strategic commercial partnerships to provide global reach and leverage local expertise in markets that include the United States, Europe, Japan, China, and other Asian countries and large parts of South America, Africa and the Middle East. HEADQUARTERED IN REYKJAVIK ICELAND +30 PIPELINE PRODUCTS 5 ON - MARKET PRODUCTS REACHING 90 MARKETS WORLDWIDE ~1,500 GLOBAL EMPLOYEES % 31.2% Aztiq Pharma Partners S.a. r.l. 29.1% Alvogen Lux Holdings S.a. r.l. 1.4% Lífeyrissj.starfsm.rík. A - deild 1.3% The Vanguard Group 1.2% Birta pension fund 1.0% Stapi pension fund 0.9% Frjálsi pension fund 0.8% Bracebridge Capital 0.6% Festa pension fund 0.6% Almenni pension fund 31.9% All other shareholders 100.0% Shareholder structure As of 31 December 2025 Board of Directors Robert Wessman (Executive Chairman) Richard Davies (Vice - Chairman) Arni Hardarsson Ann Merchant Tomas Ekman Hjorleifur Palsson Lisa Graver Stock market listings Nasdaq US (ALVO) Nasdaq OMX Iceland (ALVO) Nasdaq Stockholm (ALVO SDB)

Additional information and contacts We want to hear from you! Follow us and join the conversation alvotech.com investors.alvotech.com alvotech.ir@alvotech.com Balaji Prasad Chief Strategy Officer balajip@alvotech.com Patrik Ling VP of IR Scandinavia patrikl@alvotech.com Benedikt Stefansson VP of IR and Communications alvotech.ir@alvotech.com US SE IS Financial calendar and upcoming events Q4 2025 and FY2025 Earnings Call March 19, 2026 Q1 2026: May 6, 2026 AGM 2026: June 3, 2026 Q2 2026: August 19, 2026 Q3 2026: November 11, 2026 Q4 2026: March 10, 2027 19 Investor meeting and live broadcast Alvotech will conduct a business update conference call and live audio webcast on Thursday, March 19, at 8:00 am EST (12:00 GMT / 13:00 CET ). To listen to the webcast, register here: Q4 and Full Year 2025 webcast registration . To participate in the Q&A, register here: Q4 and Full Year 2025 conference call registration . A replay of the webcast will be made available following the call for 90 days.
Exhibit 99.3
z Full Year and Q4 2025 Earnings Presentation 19 MARCH 2026
Disclaimer 2 This presentation (“Presentation”) does not contain or constitute an offer to sell, a solicitation of an offer to buy, or a recommendation to purchase any security of Alvotech (the “Company”) to any person in the United States or in any jurisdiction to whom or in which such offer or solicitation is unlawful. Any trademarks, servicemarks, trade names and copyrights of the Company and other companies contained in this Presentation are the property of their respective owners. This Presentation is strictly confidential to the recipient, it is being distributed to a limited range of invited persons solely for their own information, may not be distributed to the press or any other person, and may not be reproduced or published, in whole or in part, in any form. Failure to comply with this restriction may constitute a violation of applicable securities laws. Forward - Looking Statements Certain statements in this communication may be considered “forward - looking statements” within the meaning of the Private Securities Litigation Reform Act of 1995, as amended. Forward - looking statements include, for example, Alvotech’s expectations regarding competitive advantages, business prospects and opportunities including pipeline product development, future plans and intentions, regulatory submissions, review and interactions, the potential approval and commercial launch of its product candidates, the timing of regulatory approval, market launches and financial projections. Such forward - looking statements are subject to risks, uncertainties, and other factors which could cause actual results to differ materially from those expressed or implied by such forward - looking statements. These forward - looking statements are based upon estimates and assumptions that, while considered reasonable by Alvotech and its management, are inherently Factors that may cause actual results to differ materially from current expectations include, but are not limited to factors set forth in the sections entitled “Risk Factors” and documents that Alvotech may from time - to - time file or furnish with the SEC. There may be additional risks that Alvotech does not presently know or that Alvotech currently believes are immaterial that could also cause actual results to differ from those contained in the forward - looking statements. These forward - looking statements are provided for illustrative purposes only and are not intended to serve as, and must not be relied on by an investor as, a guarantee, assurance, prediction or definitive statement of a fact or probability. Alvotech does not undertake any duty to update these forward - looking statements or to inform the recipient of any matters of which any of them becomes aware of which may affect any matter referred to in this communication. Alvotech disclaims any and all liability for any loss or damage (whether foreseeable or not) suffered or incurred by any person or entity as a result of anything contained or omitted from this communication and such liability is expressly disclaimed . uncertain and are inherently subject to risks, variability, and Company’s financial results. Therefore, these measures contingencies, many of which are beyond Alvotech’s control. should not be considered in isolation or as an alternative to Non - IFRS Financial Measures This Presentation may include projections of certain financial measures not presented in accordance with International Financial Reporting Standards (“IFRS”) including, but not limited to, Adjusted EBITDA and certain ratios and other metrics derived therefrom. These non - IFRS financial measures are not measures of financial performance in accordance with IFRS and may exclude items that are significant in understanding and assessing the net income, cash flows from operations or other measures of profitability, liquidity or performance under IFRS. You should be aware that the Company’s presentation of these “Cautionary Note Regarding Forward - Looking Statements” in measures may not be comparable to similarly - titled measures used by other companies. The Company believes these non - IFRS measures of financial results provide useful information to management and investors regarding certain financial and business trends relating to the Company’s financial condition and results of operations. The Company believes that the use of these non - IFRS financial measures provide an additional tool for investors to use in evaluating ongoing operating results and trends and in comparing the Company’s financial measures with other similar companies, many of which present similar non - IFRS financial measures to investors. These non - IFRS financial measures are subject to inherent limitations as they reflect the exercise of judgments by management about which expense and income are excluded or included in determining these non - IFRS financial measures. Due to the high variability and difficulty in making accurate forecasts and projections of some of the information excluded from these projected measures, together with some of the excluded information not being ascertainable or accessible, the Company is unable to quantify certain amounts that would be required to be included in the most directly comparable IFRS financial measures without unreasonable effort. Consequently, no disclosure of estimated comparable IFRS measures is included and no reconciliation of the forward - looking non - IFRS financial measures is included. For the same reasons, the Company is unable to address the probable significance of the unavailable information, which could be material to future results.
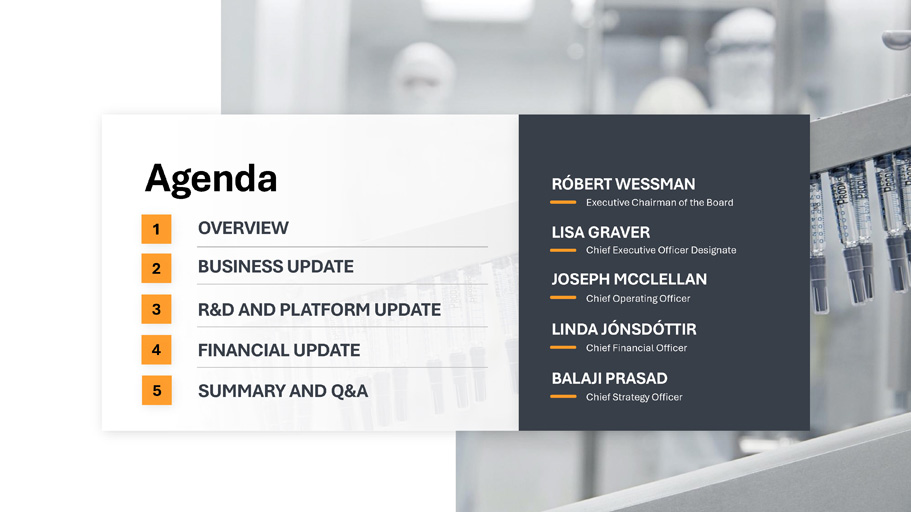
z Agenda RÓBERT WESSMAN Executive Chairman of the Board LISA GRAVER Chief Executive Officer Designate JOSEPH MCCLELLAN Chief Operating Officer LINDA JÓNSDÓTTIR Chief Financial Officer BALAJI PRASAD Chief Strategy Officer 1 2 3 4 OVERVIEW BUSINESS UPDATE R&D AND PLATFORM UPDATE FINANCIAL UPDATE 5 SUMMARY AND Q&A

Overview ROBERT WESSMAN, Executive Chairman
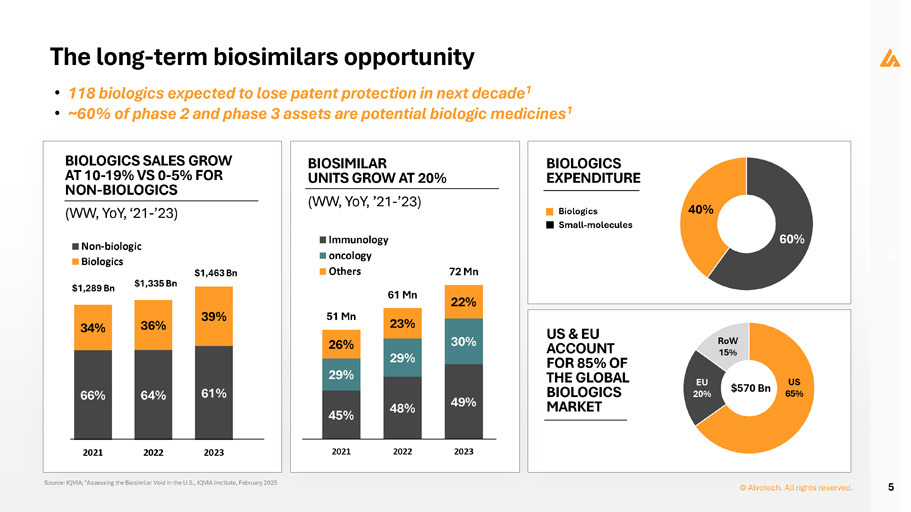
BIOLOGICS SALES GROW AT 10 - 19% VS 0 - 5% FOR NON - BIOLOGICS (WW, YoY, ‘21 - ’23) BIOSIMILAR UNITS GROW AT 20% (WW, YoY, ’21 - ’23) 66% 64% 61% 34% 36% 39% $1,289 Bn $1,335 Bn $1,463 Bn 2021 2022 2023 Non - biologic Biologics 45% 48% 49% 29% 29% 30% 26% 23% 22% 51 Mn 61 Mn 72 Mn 2021 2022 2023 Immunology oncology Others US & EU ACCOUNT FOR 85% OF THE GLOBAL BIOLOGICS MARKET US 65% EU 20% RoW 15% $570 Bn Source: IQVIA; 1 Assessing the Biosimilar Void in the U.S., IQVIA Institute, February 2025 5 © Alvotech. All rights reserved. BIOLOGICS EXPENDITURE Biologics Small - molecules The long - term biosimilars opportunity • 118 biologics expected to lose patent protection in next decade 1 • ~60% of phase 2 and phase 3 assets are potential biologic medicines 1 60% 40%
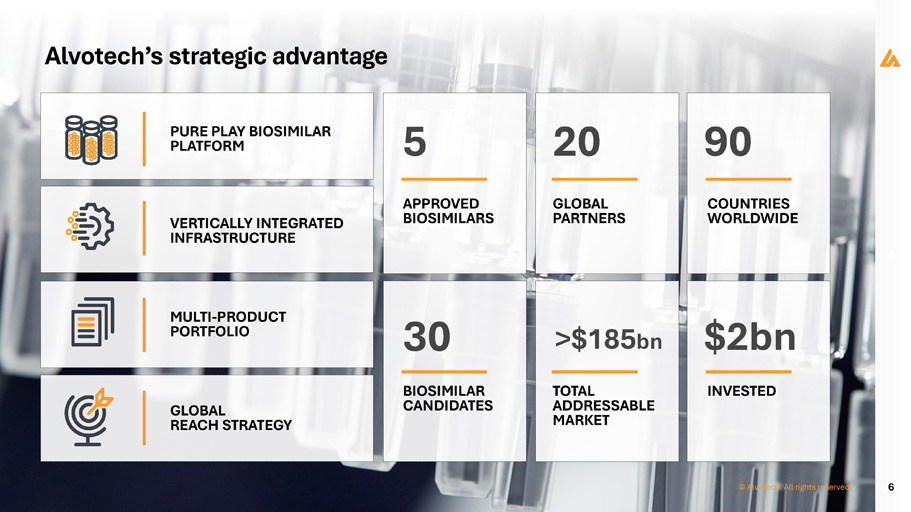
Alvotech’s strategic advantage 6 VERTICALLY INTEGRATED INFRASTRUCTURE MULTI - PRODUCT PORTFOLIO GLOBAL REACH STRATEGY PURE PLAY BIOSIMILAR PLATFORM 5 APPROVED BIOSIMILARS 20 90 30 >$185 bn GLOBAL PARTNERS COUNTRIES WORLDWIDE BIOSIMILAR CANDIDATES TOTAL ADDRESSABLE MARKET $2bn INVESTED © Alvotech. All rights reserved.

Strengthening the Corporate Leadership Team Key operational roles now all onsite in Iceland Lisa Graver CHIEF EXECUTIVE OFFICER DESIGNATE Linda Jonsdottir CHIEF FINANCIAL OFFICER Joseph McClellan CHIEF OPERATING OFFICER Anthony M. Maffia III CHIEF QUALITY AND REGULATORY OFFICER Dr. Balaji V. Prasad, MD CHIEF STRATEGY OFFICER
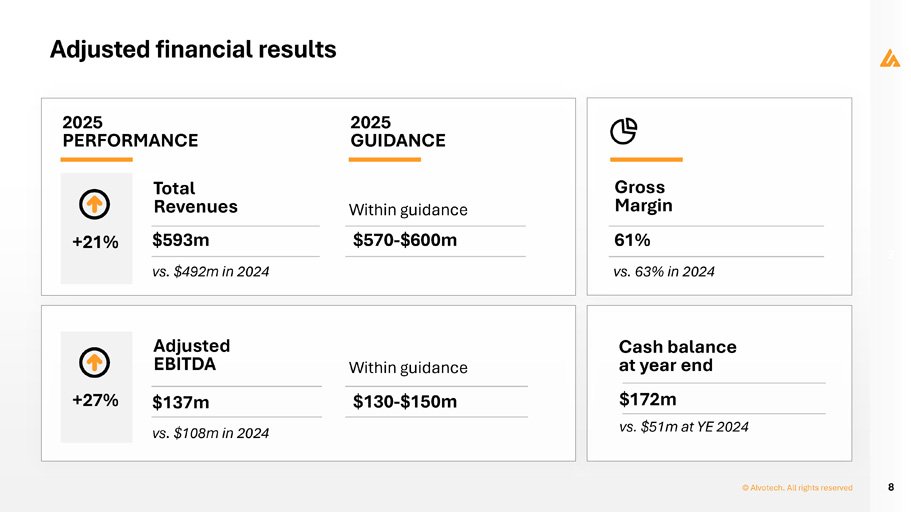
8 © Alvotech. All rights reserved Adjusted financial results 2025 PERFORMANCE Adjusted EBITDA $137m Total Revenues $593m vs. $492m in 2024 vs. $108m in 2024 2025 GUIDANCE $130 - $150m Within guidance $570 - $600m Gross Margin 61% Cash balance at year end $172m vs. 63% in 2024 +21% +27% Within guidance vs. $51m at YE 2024

z Business update LISA GRAVER, Chief Executive Officer Designate
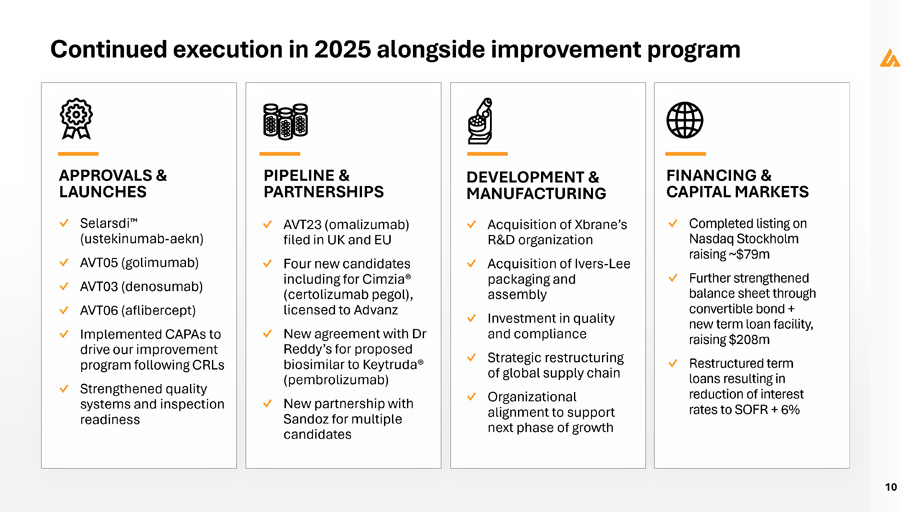
10 Continued execution in 2025 alongside improvement program APPROVALS & LAUNCHES PIPELINE & PARTNERSHIPS DEVELOPMENT & MANUFACTURING ✓ Selarsdi (ustekinumab - aekn) ✓ AVT05 (golimumab) ✓ AVT03 (denosumab) ✓ AVT06 (aflibercept) ✓ Implemented CAPAs to drive our improvement program following CRLs ✓ Strengthened quality systems and inspection readiness ✓ AVT23 (omalizumab) filed in UK and EU ✓ Four new candidates including for Cimzia® (certolizumab pegol), licensed to Advanz ✓ New agreement with Dr Reddy’s for proposed biosimilar to Keytruda® (pembrolizumab) ✓ New partnership with Sandoz for multiple candidates ✓ Acquisition of Xbrane’s R&D organization ✓ Acquisition of Ivers - Lee packaging and assembly ✓ Investment in quality and compliance ✓ Strategic restructuring of global supply chain ✓ Organizational alignment to support next phase of growth FINANCING & CAPITAL MARKETS ✓ Completed listing on Nasdaq Stockholm raising ~$79m ✓ Further strengthened balance sheet through convertible bond + new term loan facility, raising $208m ✓ Restructured term loans resulting in reduction of interest rates to SOFR + 6%
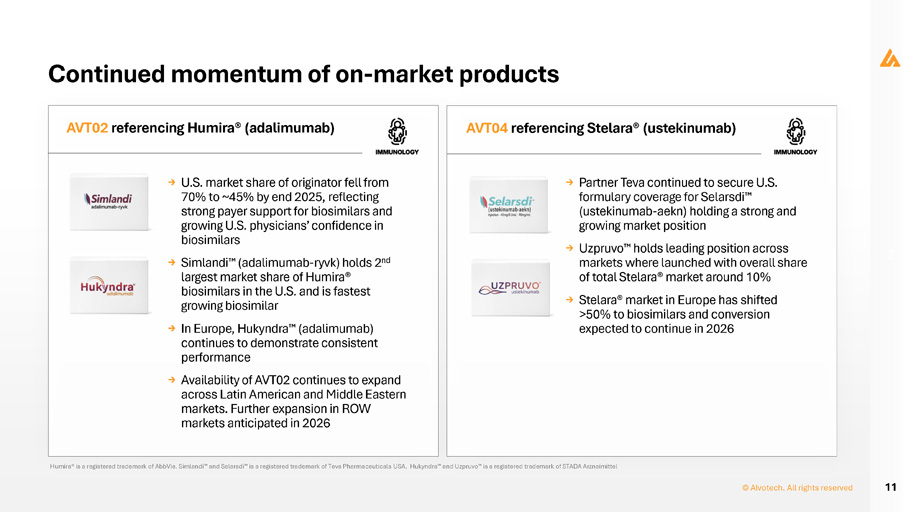
11 © Alvotech. All rights reserved AVT02 referencing Humira® (adalimumab) AVT04 referencing Stelara® (ustekinumab) Continued momentum of on - market products → U.S. market share of originator fell from 70% to ~45% by end 2025, reflecting strong payer support for biosimilars and growing U.S. physicians’ confidence in biosimilars → Simlandi (adalimumab - ryvk) holds 2 nd largest market share of Humira® biosimilars in the U.S. and is fastest growing biosimilar → In Europe, Hukyndra (adalimumab) continues to demonstrate consistent performance → Availability of AVT02 continues to expand across Latin American and Middle Eastern markets. Further expansion in ROW markets anticipated in 2026 → Partner Teva continued to secure U.S. formulary coverage for Selarsdi (ustekinumab - aekn) holding a strong and growing market position → Uzpruvo holds leading position across markets where launched with overall share of total Stelara® market around 10% → Stelara® market in Europe has shifted >50% to biosimilars and conversion expected to continue in 2026 Humira® is a registered trademark of AbbVie. Simlandi and Selarsdi is a registered trademark of Teva Pharmaceuticals USA. Hukyndra and Uzpruvo is a registered trademark of STADA Arzneimittel
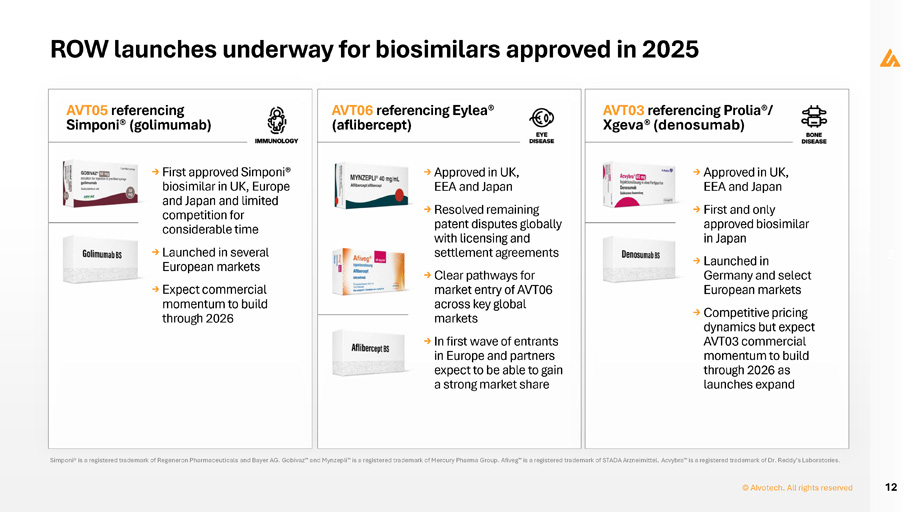
12 © Alvotech. All rights reserved ROW launches underway for biosimilars approved in 2025 AVT05 referencing Simponi® (golimumab) → Approved in UK, EEA and Japan → Resolved remaining patent disputes globally with licensing and settlement agreements → Clear pathways for market entry of AVT06 across key global markets → In first wave of entrants in Europe and partners expect to be able to gain a strong market share → First approved Simponi® biosimilar in UK, Europe and Japan and limited competition for considerable time → Launched in several European markets → Expect commercial momentum to build through 2026 AVT06 referencing Eylea® (aflibercept) AVT03 referencing Prolia®/ Xgeva® (denosumab) → Approved in UK, EEA and Japan → First and only approved biosimilar in Japan → Launched in Germany and select European markets → Competitive pricing dynamics but expect AVT03 commercial momentum to build through 2026 as launches expand Simponi® is a registered trademark of Regeneron Pharmaceuticals and Bayer AG. Gobivaz and Mynzepli is a registered trademark of Mercury Pharma Group. Afiveg is a registered trademark of STADA Arzneimittel. Acvybra is a registered trademark of Dr. Reddy’s Laboratories.

R&D and platform update JOSEPH MCCLELLAN, Chief Operating Officer
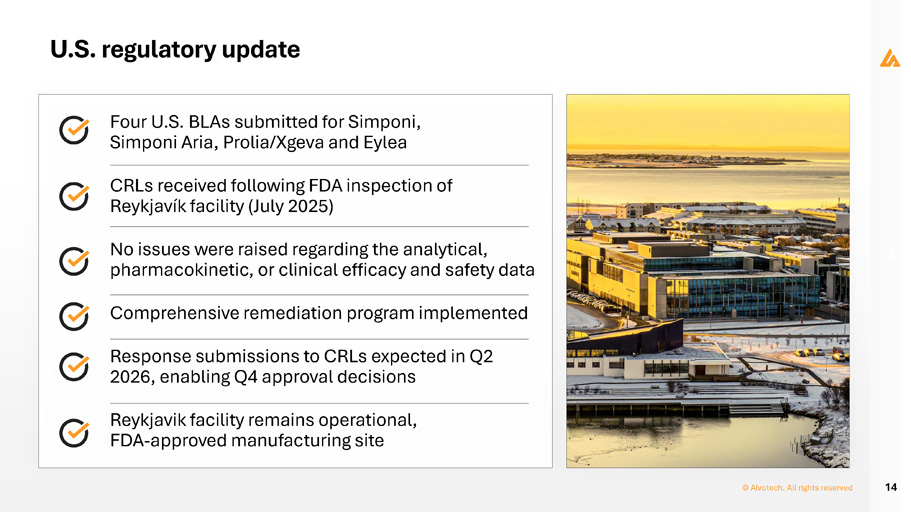
Four U.S. BLAs submitted for Simponi, Simponi Aria, Prolia/Xgeva and Eylea CRLs received following FDA inspection of Reykjavík facility (July 2025) No issues were raised regarding the analytical, pharmacokinetic, or clinical efficacy and safety data Comprehensive remediation program implemented Response submissions to CRLs expected in Q2 2026, enabling Q4 approval decisions Reykjavik facility remains operational, FDA - approved manufacturing site 14 © Alvotech. All rights reserved U.S. regulatory update
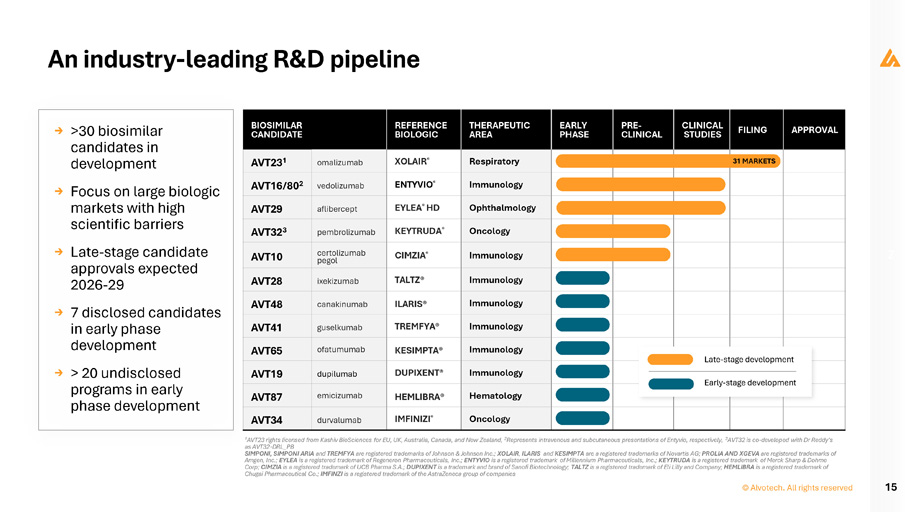
An industry - leading R&D pipeline 15 APPROVAL FILING CLINICAL STUDIES PRE - CLINICAL EARLY PHASE THERAPEUTIC AREA REFERENCE BIOLOGIC BIOSIMILAR CANDIDATE 31 MARKETS Respiratory XOLAIR ® omalizumab AVT23 1 Immunology ENTYVIO ® vedolizumab AVT16/80 2 Ophthalmology EYLEA ® HD aflibercept AVT29 Oncology KEYTRUDA ® pembrolizumab AVT32 3 Immunology CIMZIA ® certolizumab pegol AVT10 Immunology TALTZ® ixekizumab AVT28 Immunology ILARIS® canakinumab AVT48 Immunology TREMFYA® guselkumab AVT41 nt age developme Late - st Immunology KESIMPTA® ofatumumab AVT65 Immunology DUPIXENT® dupilumab AVT19 nt tage developme Early - s Hematology HEMLIBRA® emicizumab AVT87 Oncology IMFINIZI ® durvalumab AVT34 → > 30 biosimilar candidates in development → Focus on large biologic markets with high scientific barriers → Late - stage candidate approvals expected 2026 - 29 → 7 disclosed candidates in early phase development → > 20 undisclosed programs in early phase development 1 AVT23 rights licensed from Kashiv BioSciences for EU, UK, Australia, Canada, and New Zealand, 2 Represents intravenous and subcutaneous presentations of Entyvio, respectively, 3 AVT32 is co - developed with Dr Reddy’s as AVT32 - DRL_PB SIMPONI, SIMPONI ARIA and TREMFYA are registered trademarks of Johnson & Johnson Inc.; XOLAIR , ILARIS and KESIMPTA are a registered trademarks of Novartis AG; PROLIA AND XGEVA are registered trademarks of Amgen, Inc.; EYLEA is a registered trademark of Regeneron Pharmaceuticals, Inc.; ENTYVIO is a registered trademark of Millennium Pharmaceuticals, Inc.; KEYTRUDA is a registered trademark of Merck Sharp & Dohme Corp; CIMZIA is a registered trademark of UCB Pharma S.A.; DUPIXENT is a trademark and brand of Sanofi Biotechnology; TALTZ is a registered trademark of Eli Lilly and Company; HEMLIBRA is a registered trademark of Chugai Pharmaceutical Co.; IMFINZI is a registered trademark of the AstraZeneca group of companies © Alvotech. All rights reserved
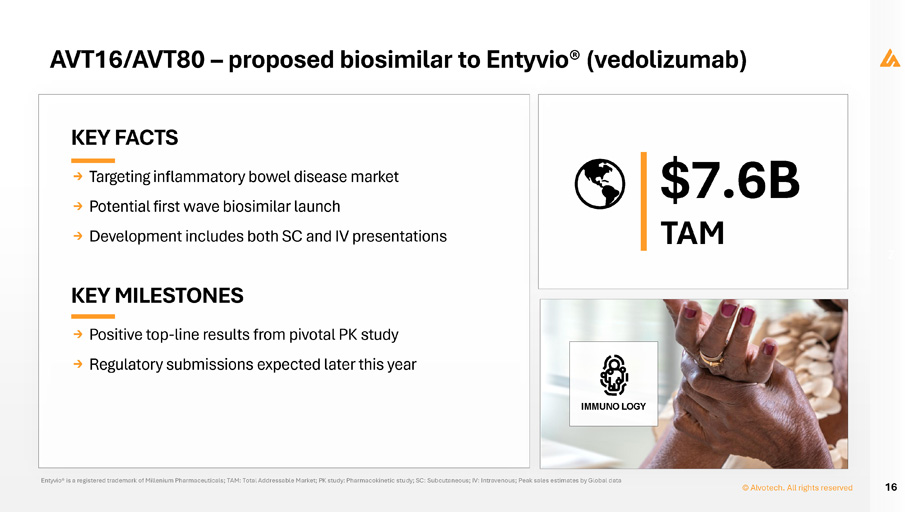
16 © Alvotech. All rights reserved Entyvio® is a registered trademark of Millenium Pharmaceuticals; TAM: Total Addressable Market; PK study: Pharmacokinetic study; SC: Subcutaneous; IV: Intravenous; Peak sales estimates by Global data $7.6B TAM KEY MILESTONES → Positive top - line results from pivotal PK study → Regulatory submissions expected later this year AVT16/AVT80 – proposed biosimilar to Entyvio® (vedolizumab) KEY FACTS → Targeting inflammatory bowel disease market → Potential first wave biosimilar launch → Development includes both SC and IV presentations
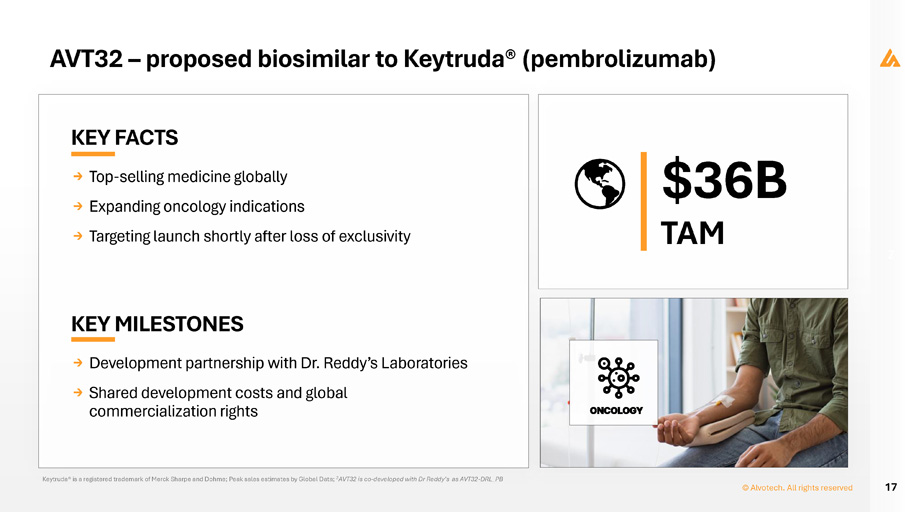
17 © Alvotech. All rights reserved AVT32 – proposed biosimilar to Keytruda® (pembrolizumab) Keytruda® is a registered trademark of Merck Sharpe and Dohme; Peak sales estimates by Global Data; 3 AVT32 is co - developed with Dr Reddy’s as AVT32 - DRL_PB $36B TAM KEY MILESTONES → Development partnership with Dr. Reddy’s Laboratories → Shared development costs and global commercialization rights KEY FACTS → Top - selling medicine globally → Expanding oncology indications → Targeting launch shortly after loss of exclusivity
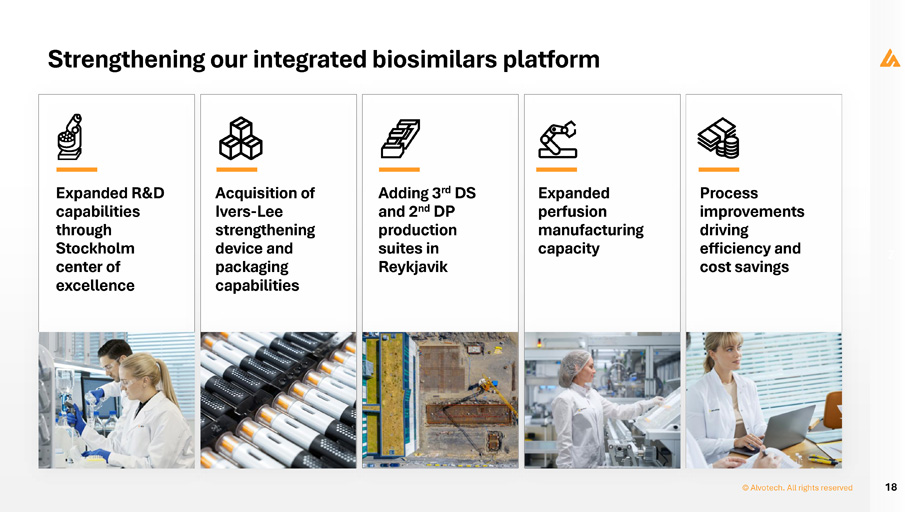
18 © Alvotech. All rights reserved Strengthening our integrated biosimilars platform Expanded R&D capabilities through Stockholm center of excellence Acquisition of Ivers - Lee strengthening device and packaging capabilities Adding 3 rd DS and 2 nd DP production suites in Reykjavik Expanded perfusion manufacturing capacity Process improvements driving efficiency and cost savings
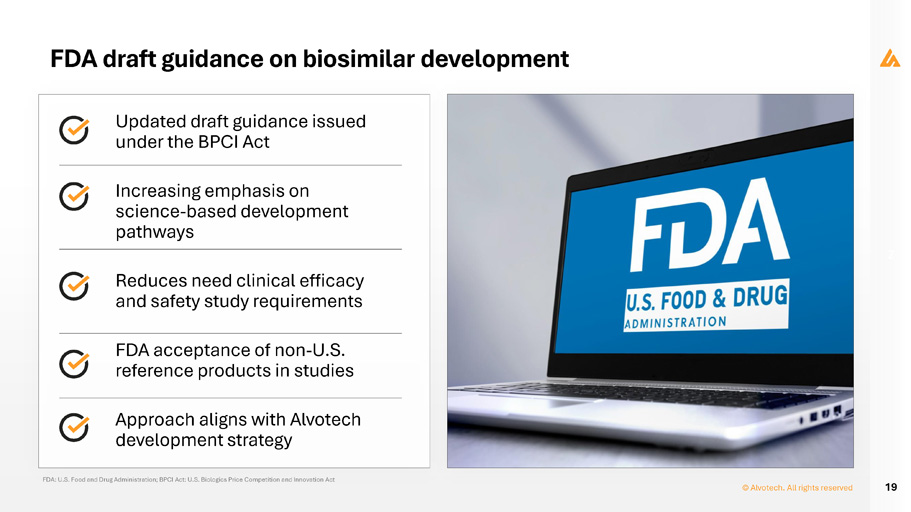
Updated draft guidance issued under the BPCI Act Increasing emphasis on science - based development pathways Reduces need clinical efficacy and safety study requirements FDA acceptance of non - U.S. reference products in studies Approach aligns with Alvotech development strategy 19 © Alvotech. All rights reserved FDA draft guidance on biosimilar development FDA: U.S. Food and Drug Administration; BPCI Act: U.S. Biologics Price Competition and Innovation Act
20 © Alvotech. All rights reserved Positioned for continued biosimilar growth Progress across late - and early - stage pipeline programs Continued regulatory advancement in major markets Expanding development and manufacturing capabilities Integrated platform supporting long - term biosimilar leadership
Financial results LINDA JONSDOTTIR, Chief Financial Officer
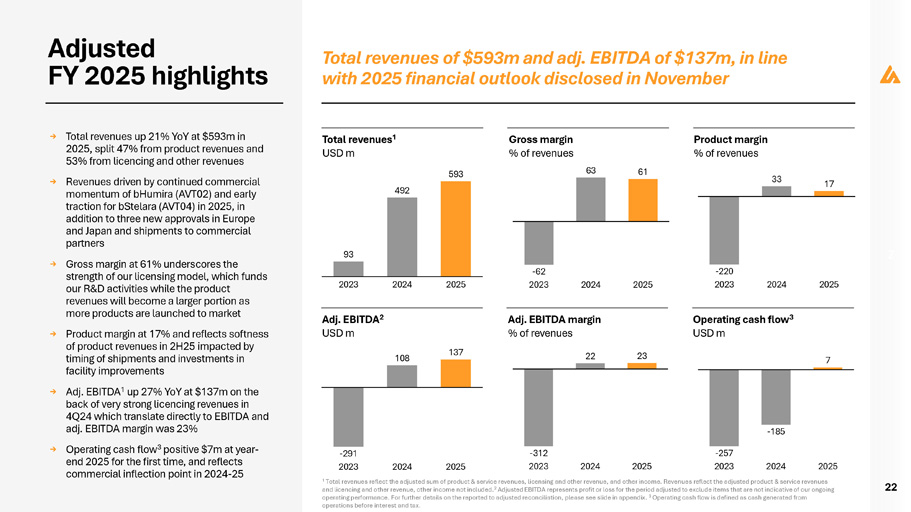
Adjusted FY 2025 highlights 22 Total revenues of $593m and adj. EBITDA of $137m, in line with 2025 financial outlook disclosed in November Total revenues 1 USD m Gross margin % of revenues Product margin % of revenues Adj. EBITDA 2 USD m Adj. EBITDA margin % of revenues 22 Operating cash flow 3 USD m 93 492 593 2023 2024 2025 33 17 - 220 2023 2024 2025 108 - 291 2023 2024 2025 137 63 61 - 62 2023 2024 2025 → Total revenues up 21% YoY at $593m in 2025, split 47% from product revenues and 53% from licencing and other revenues → Revenues driven by continued commercial momentum of bHumira (AVT02) and early traction for bStelara (AVT04) in 2025, in addition to three new approvals in Europe and Japan and shipments to commercial partners → Gross margin at 61% underscores the strength of our licensing model, which funds our R&D activities while the product revenues will become a larger portion as more products are launched to market → Product margin at 17% and reflects softness of product revenues in 2H25 impacted by timing of shipments and investments in facility improvements → Adj. EBITDA 1 up 27% YoY at $137m on the back of very strong licencing revenues in 4Q24 which translate directly to EBITDA and adj. EBITDA margin was 23% → Operating cash flow 3 positive $7m at year - end 2025 for the first time, and reflects commercial inflection point in 2024 - 25 - 312 2023 2024 2025 23 - 185 - 257 2023 2024 2025 7 1 Total revenues reflect the adjusted sum of product & service revenues, licensing and other revenue, and other income. Revenues reflect the adjusted product & service revenues and licencing and other revenue, other income not included. 2 Adjusted EBITDA represents profit or loss for the period adjusted to exclude items that are not indicative of our ongoing operating performance. For further details on the reported to adjusted reconciliation, please see slide in appendix. 3 Operating cash flow is defined as cash generated from operations before interest and tax.
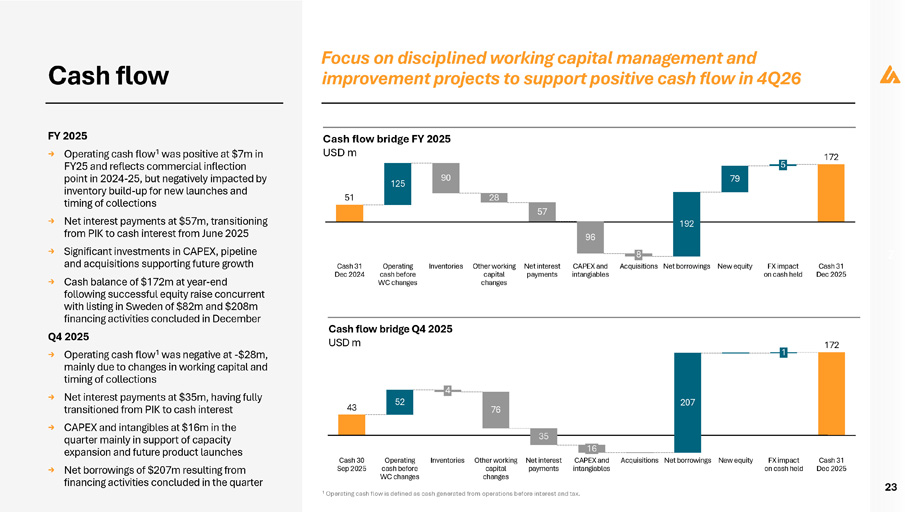
Cash flow FY 2025 → Operating cash flow 1 was positive at $7m in FY25 and reflects commercial inflection point in 2024 - 25, but negatively impacted by inventory build - up for new launches and timing of collections → Net interest payments at $57m, transitioning from PIK to cash interest from June 2025 → Significant investments in CAPEX, pipeline and acquisitions supporting future growth → Cash balance of $172m at year - end following successful equity raise concurrent with listing in Sweden of $82m and $208m financing activities concluded in December Q4 2025 → Operating cash flow 1 was negative at - $ 28 m, mainly due to changes in working capital and timing of collections → Net interest payments at $ 35 m, having fully transitioned from PIK to cash interest → CAPEX and intangibles at $16m in the quarter mainly in support of capacity expansion and future product launches → Net borrowings of $207m resulting from financing activities concluded in the quarter 23 Focus on disciplined working capital management and improvement projects to support positive cash flow in 4Q26 Cash flow bridge Q4 2025 USD m Cash flow bridge FY 2025 USD m 51 172 125 90 28 57 79 Cash 31 Dec 2024 Operating cash before WC changes Inventories Other working capital changes Net interest payments 96 CAPEX and intangiables 192 8 Acquisitions Net borrowings New equity 5 FX impact on cash held Cash 31 Dec 2025 43 172 52 76 Cash 30 Sep 2025 Operating Inventories cash before WC changes 4 Other working capital changes 35 16 207 Net interest CAPEX and Acquisitions Net borrowings payments intangiables New equity 1 FX impact on cash held Cash 31 Dec 2025 1 Operating cash flow is defined as cash generated from operations before interest and tax.
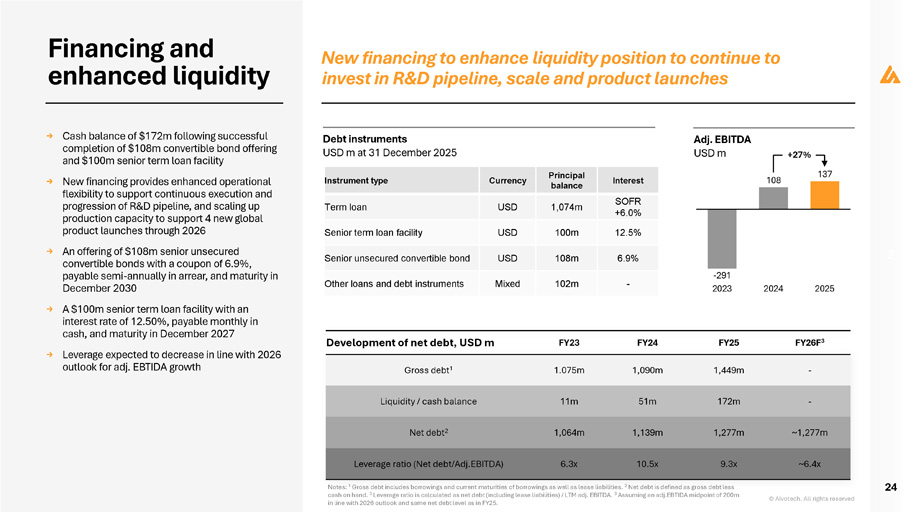
→ Cash balance of $172m following successful completion of $108m convertible bond offering and $100m senior term loan facility → New financing provides enhanced operational flexibility to support continuous execution and progression of R&D pipeline, and scaling up production capacity to support 4 new global product launches through 2026 → An offering of $108m senior unsecured convertible bonds with a coupon of 6.9%, payable semi - annually in arrear, and maturity in December 2030 → A $100m senior term loan facility with an interest rate of 12.50%, payable monthly in cash, and maturity in December 2027 → Leverage expected to decrease in line with 2026 outlook for adj. EBTIDA growth © Alvotech. All rights reserved 24 New financing to enhance liquidity position to continue to invest in R&D pipeline, scale and product launches Financing and enhanced liquidity FY26F 3 FY25 FY24 FY23 Development of net debt, USD m - 1,449m 1,090m 1.075m Gross debt 1 - 172m 51m 11m Liquidity / cash balance ~1,277m 1,277m 1,139m 1,064m Net debt 2 ~6.4x 9.3x 10.5x 6.3x Leverage ratio (Net debt/Adj.EBITDA) Notes: 1 Gross debt includes borrowings and current maturities of borrowings as well as lease liabilities. 2 Net debt is defined as gross debt less cash on hand. 3 Leverage ratio is calculated as net debt (including lease liabilities) / LTM adj. EBITDA. 3 Assuming an adj.EBTIDA midpoint of 200m in line with 2026 outlook and same net debt level as in FY25. 108 - 291 2023 137 2024 2025 +27% Adj. EBITDA USD m Debt instruments USD m at 31 December 2025 Interest Principal balance Currency Instrument type SOFR +6.0% 1,074m USD Term loan 12.5% 100m USD Senior term loan facility 6.9% 108m USD Senior unsecured convertible bond - 102m Mixed Other loans and debt instruments
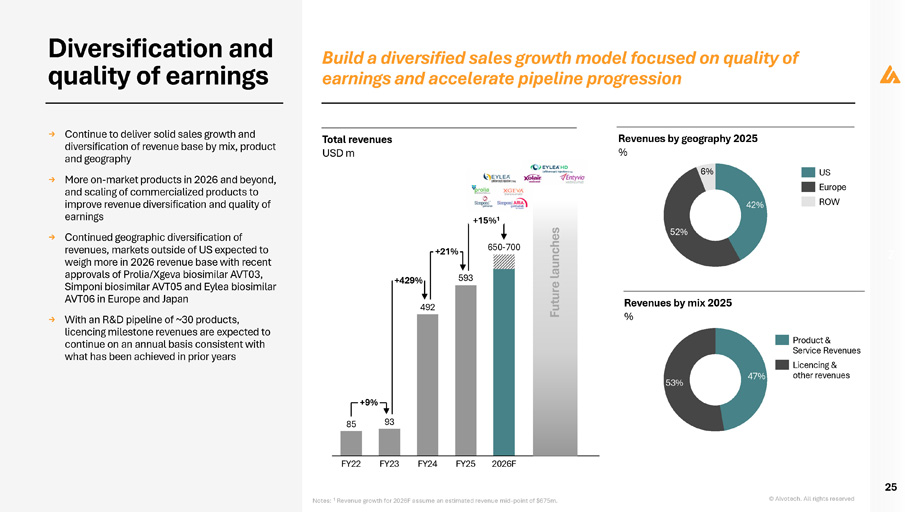
→ Continue to deliver solid sales growth and diversification of revenue base by mix, product and geography → More on - market products in 2026 and beyond, and scaling of commercialized products to improve revenue diversification and quality of earnings → Continued geographic diversification of revenues, markets outside of US expected to weigh more in 2026 revenue base with recent approvals of Prolia/Xgeva biosimilar AVT03, Simponi biosimilar AVT05 and Eylea biosimilar AVT06 in Europe and Japan → With an R&D pipeline of ~30 products, licencing milestone revenues are expected to continue on an annual basis consistent with what has been achieved in prior years © Alvotech. All rights reserved 25 Build a diversified sales growth model focused on quality of earnings and accelerate pipeline progression Total revenues USD m Revenues by mix 2025 % Diversification and quality of earnings 85 93 492 FY22 FY23 FY24 FY25 2026F 593 650 - 700 +9% +429% +21% +15% 1 Notes: 1 Revenue growth for 2026F assume an estimated revenue mid - point of $675m. Future launches 42% 52% Revenues by geography 2025 % 6% US Europe ROW 47% 53% Product & Service Revenues Licencing & other revenues
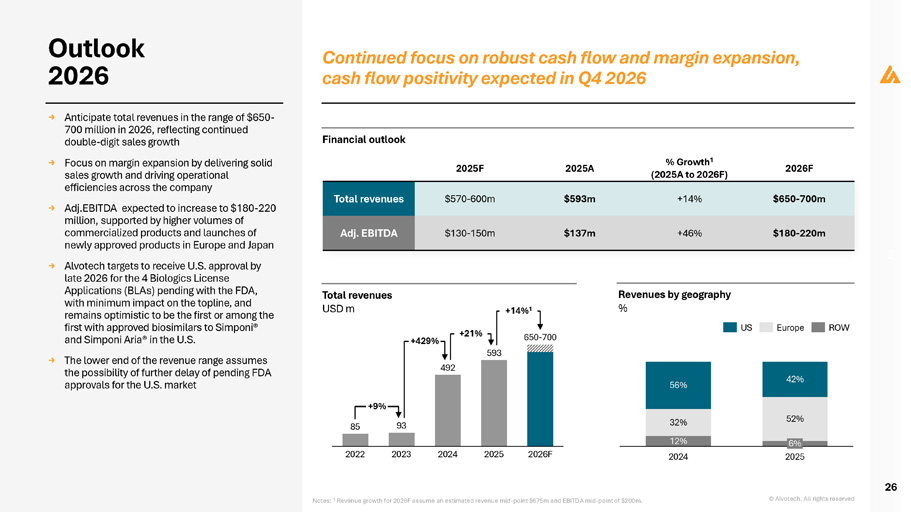
Outlook 2026 → Anticipate total revenues in the range of $650 - 700 million in 2026, reflecting continued double - digit sales growth → Focus on margin expansion by delivering solid sales growth and driving operational efficiencies across the company → Adj.EBITDA expected to increase to $180 - 220 million, supported by higher volumes of commercialized products and launches of newly approved products in Europe and Japan → Alvotech targets to receive U.S. approval by late 2026 for the 4 Biologics License Applications (BLAs) pending with the FDA, with minimum impact on the topline, and remains optimistic to be the first or among the first with approved biosimilars to Simponi® and Simponi Aria® in the U.S. → The lower end of the revenue range assumes the possibility of further delay of pending FDA approvals for the U.S. market © Alvotech. All rights reserved 26 Continued focus on robust cash flow and margin expansion, cash flow positivity expected in Q4 2026 Financial outlook 2026F % Growth 1 (2025A to 2026F) 2025A 2025F $650 - 700m +14% $593m $570 - 600m Total revenues $180 - 220m +46% $137m $130 - 150m Adj. EBITDA 85 93 492 593 2022 2023 2024 2025 2026F 650 - 700 +9% +429% +21% +14% 1 Notes: 1 Revenue growth for 2026F assume an estimated revenue mid - point $675m and EBITDA mid - point of $200m. Revenues by geography % Total revenues USD m 12% 32% 52% 56% 42% 2024 6% 2025 US Europe ROW
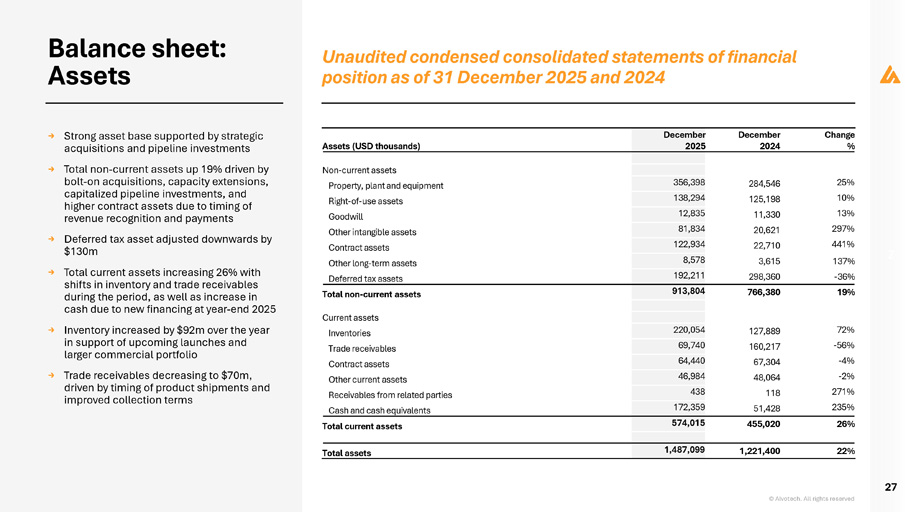
Balance sheet: Assets → Strong asset base supported by strategic acquisitions and pipeline investments → Total non - current assets up 19% driven by bolt - on acquisitions, capacity extensions, capitalized pipeline investments, and higher contract assets due to timing of revenue recognition and payments → Deferred tax asset adjusted downwards by $130m → Total current assets increasing 26% with shifts in inventory and trade receivables during the period, as well as increase in cash due to new financing at year - end 2025 → Inventory increased by $92m over the year in support of upcoming launches and larger commercial portfolio → Trade receivables decreasing to $70m, driven by timing of product shipments and improved collection terms © Alvotech. All rights reserved 27 Unaudited condensed consolidated statements of financial position as of 31 December 2025 and 2024 Change % December 2024 December 2025 Assets (USD thousands) Non - current assets 25% 284,546 356,398 Property, plant and equipment 10% 125,198 138,294 Right - of - use assets 13% 11,330 12,835 Goodwill 297% 20,621 81,834 Other intangible assets 441% 22,710 122,934 Contract assets 137% 3,615 8,578 Other long - term assets - 36% 298,360 192,211 Deferred tax assets 19% 766,380 913,804 Total non - current assets Current assets 72% 127,889 220,054 Inventories - 56% 160,217 69,740 Trade receivables - 4% 67,304 64,440 Contract assets - 2% 48,064 46,984 Other current assets 271% 118 438 Receivables from related parties 235% 51,428 172,359 Cash and cash equivalents 26% 455,020 574,015 Total current assets 22% 1,221,400 1,487,099 Total assets
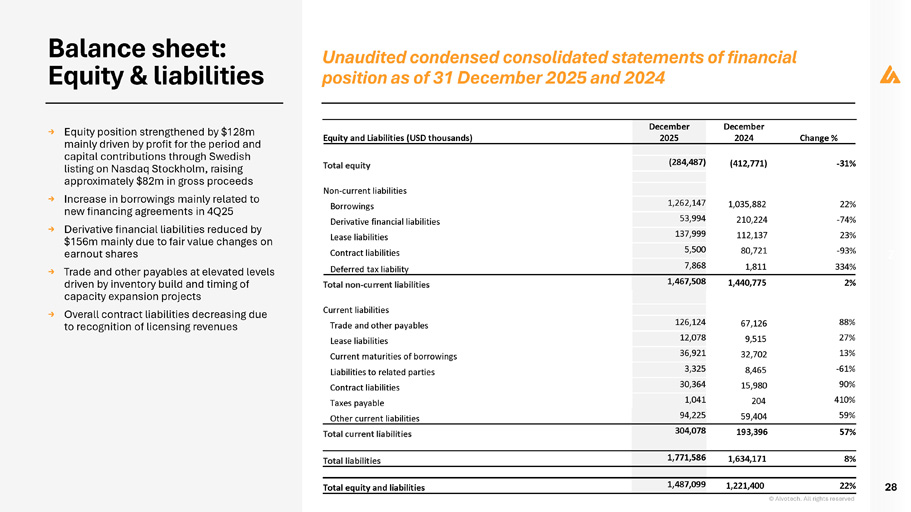
Balance sheet: Equity & liabilities → Equity position strengthened by $128m mainly driven by profit for the period and capital contributions through Swedish listing on Nasdaq Stockholm, raising approximately $82m in gross proceeds → Increase in borrowings mainly related to new financing agreements in 4Q25 → Derivative financial liabilities reduced by $156m mainly due to fair value changes on earnout shares → Trade and other payables at elevated levels driven by inventory build and timing of capacity expansion projects → Overall contract liabilities decreasing due to recognition of licensing revenues © Alvotech. All rights reserved 28 Unaudited condensed consolidated statements of financial position as of 31 December 2025 and 2024 Change % December 2024 December 2025 Equity and Liabilities (USD thousands) - 31% (412,771) (284,487) Total equity Non - current liabilities 22% 1,035,882 1,262,147 Borrowings - 74% 210,224 53,994 Derivative financial liabilities 23% 112,137 137,999 Lease liabilities - 93% 80,721 5,500 Contract liabilities 334% 1,811 7,868 Deferred tax liability 2% 1,440,775 1,467,508 Total non - current liabilities Current liabilities 88% 67,126 126,124 Trade and other payables 27% 9,515 12,078 Lease liabilities 13% 32,702 36,921 Current maturities of borrowings - 61% 8,465 3,325 Liabilities to related parties 90% 15,980 30,364 Contract liabilities 410% 204 1,041 Taxes payable 59% 59,404 94,225 Other current liabilities 57% 193,396 304,078 Total current liabilities 8% 1,634,171 1,771,586 Total liabilities 22% 1,221,400 1,487,099 Total equity and liabilities
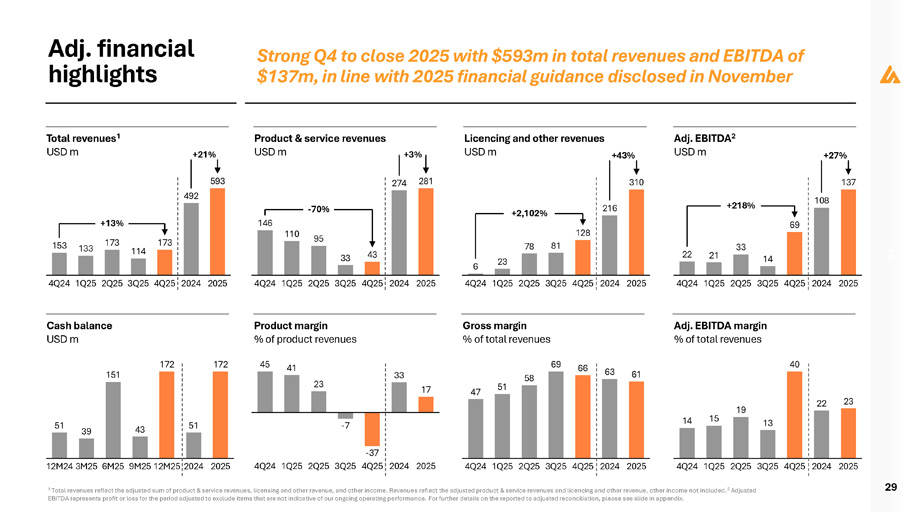
Adj. financial highlights 29 Strong Q4 to close 2025 with $593m in total revenues and EBITDA of $137m, in line with 2025 financial guidance disclosed in November Total revenues 1 USD m Product margin % of product revenues Adj. EBITDA 2 USD m Adj. EBITDA margin % of total revenues Cash balance USD m 47 51 58 69 66 63 61 51 39 151 43 172 51 172 22 21 33 14 69 108 137 4Q24 1Q25 2Q25 3Q25 4Q25 2024 2025 +218% +27% 14 15 19 13 40 22 23 2025 45 41 23 - 7 33 17 153 133 173 114 173 492 593 4Q24 1Q25 2Q25 3Q25 4Q25 2024 2025 +13% +21% 146 110 95 33 43 274 281 4Q24 1Q25 2Q25 3Q25 4Q25 2024 2025 - 70% +3% Product & service revenues USD m 6 23 78 81 128 216 310 4Q24 1Q25 2Q25 3Q25 4Q25 2024 2025 +2,102% +43% Licencing and other revenues USD m Gross margin % of total revenues - 37 12M24 3M25 6M25 9M25 12M25 2024 2025 4Q24 1Q25 2Q25 3Q25 4Q25 2024 2025 4Q24 1Q25 2Q25 3Q25 4Q25 2024 2025 4Q24 1Q25 2Q25 3Q25 4Q25 2024 1 Total revenues reflect the adjusted sum of product & service revenues, licensing and other revenue, and other income. Revenues reflect the adjusted product & service revenues and licencing and other revenue, other income not included. 2 Adjusted EBITDA represents profit or loss for the period adjusted to exclude items that are not indicative of our ongoing operating performance. For further details on the reported to adjusted reconciliation, please see slide in appendix.
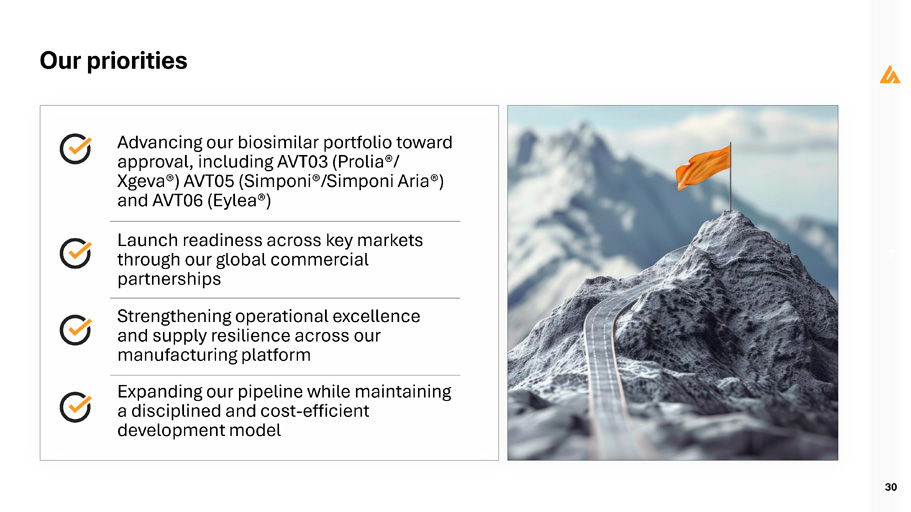
Our priorities 30 Advancing our biosimilar portfolio toward approval, including AVT03 (Prolia®/ Xgeva®) AVT05 (Simponi®/Simponi Aria®) and AVT06 (Eylea®) Launch readiness across key markets through our global commercial partnerships Strengthening operational excellence and supply resilience across our manufacturing platform Expanding our pipeline while maintaining a disciplined and cost - efficient development model

Additional information and contacts Q4 2025 Earnings Release We want to hear from you! Follow us and join the conversation alvotech.com investors.alvotech.com alvotech.ir@alvotech.com Balaji Prasad Chief Strategy Officer balajip@alvotech.com Patrik Ling VP of IR Scandinavia patrikl@alvotech.com Benedikt Stefansson VP of IR and Communications alvotech.ir@alvotech.com US SE IS Financial calendar and upcoming events Q4 2025 and FY2025 Earnings Call March 19, 2026 Q1 2026: May 6, 2026 AGM 2026: June 3, 2026 Q2 2026: August 19, 2026 Q3 2026: November 11, 2026 Q4 2026: March 10, 2027 31 Investor meeting and live broadcast Alvotech will conduct a business update conference call and live audio webcast on Thursday, March 19, at 8:00 am EST (12:00 GMT / 13:00 CET ). To listen to the webcast, register here: Q4 and Full Year 2025 webcast registration . To participate in the Q&A, register here: Q4 and Full Year 2025 conference call registration . A replay of the webcast will be made available following the call for 90 days.

z Appendix
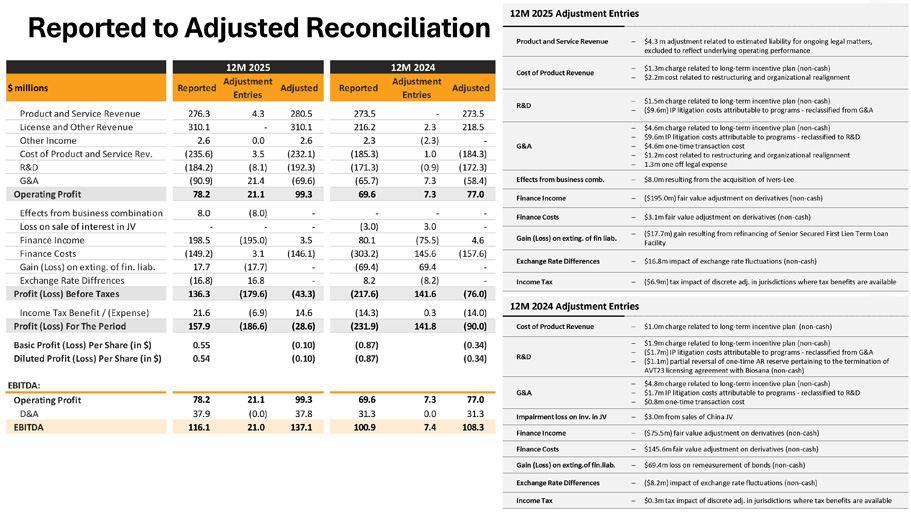
z Reported to Adjusted Reconciliation 12M 2025 Adjustment Entries Product and Service Revenue $4.3 m adjustment related to estimated liability for ongoing legal matters, excluded to reflect underlying operating performance $1.3m charge related to long - term incentive plan (non - cash) $2.2m cost related to restructuring and organizational realignment $1.5m charge related to long - term incentive plan (non - cash) ($9.6m) IP litigation costs attributable to programs - reclassified from G&A $4.6m charge related to long - term incentive plan (non - cash) $9.6m IP litigation costs attributable to programs - reclassified to R&D $4.6m one - time transaction cost $1.2m cost related to restructuring and organizational realignment 1.3m one off legal expense $8.0m resulting from the acquisition of Ivers - Lee Finance Income ($195.0m) fair value adjustment on derivatives (non - cash) Finance Costs $3.1m fair value adjustment on derivatives (non - cash) Gain (Loss) on exting. of fin liab. ($17.7m) gain resulting from refinancing of Senior Secured First Lien Term Loan Facility Exchange Rate Differences $16.8m impact of exchange rate fluctuations (non - cash) ($6.9m) tax impact of discrete adj. in jurisdictions where tax benefits are available Income Tax 12M 2024 Adjustment Entries Cost of Product Revenue $1.0m charge related to long - term incentive plan (non - cash) R&D $1.9m charge related to long - term incentive plan (non - cash) ($1.7m) IP litigation costs attributable to programs - reclassified from G&A ($1.1m) partial reversal of one - time AR reserve pertaining to the termination of AVT23 licensing agreement with Biosana (non - cash) G&A $4.8m charge related to long - term incentive plan (non - cash) $1.7m IP litigation costs attributable to programs - reclassified to R&D $0.8m one - time transaction cost Impairment loss on inv. in JV $3.0m from sales of China JV Finance Income ($75.5m) fair value adjustment on derivatives (non - cash) Finance Costs $145.6m fair value adjustment on derivatives (non - cash) Gain (Loss) on exting.of fin.liab. $69.4m loss on remeasurement of bonds (non - cash) Exchange Rate Differences ($8.2m) impact of exchange rate fluctuations (non - cash) Income Tax $0.3m tax impact of discrete adj. in jurisdictions where tax benefits are available Cost of Product Revenue R&D Adjusted 273.5 12M 2024 Adjustment Entries - Reported 273.5 Adjusted 280.5 12M 2025 Adjustment Entries 4.3 Reported 276.3 $ millions Product and Service Revenue 218.5 2.3 216.2 310.1 - 310.1 License and Other Revenue G&A - (2.3) 2.3 2.6 0.0 2.6 Other Income (184.3) 1.0 (185.3) (232.1) 3.5 (235.6) Cost of Product and Service Rev. (172.3) (0.9) (171.3) (192.3) (8.1) (184.2) R&D Effects from business comb. (58.4) 7.3 (65.7) (69.6) 21.4 (90.9) G&A Operating Profit 78.2 21.1 99.3 69.6 7.3 77.0 Effects from business combination 8.0 (8.0) - - - - Loss on sale of interest in JV - - - (3.0) 3.0 - Finance Income 198.5 (195.0) 3.5 80.1 (75.5) 4.6 Finance Costs (149.2) 3.1 (146.1) (303.2) 145.6 (157.6) Gain (Loss) on exting. of fin. liab. 17.7 (17.7) - (69.4) 69.4 - Exchange Rate Diffrences (16.8) 16.8 - 8.2 (8.2) - Profit (Loss) Before Taxes 136.3 (179.6) (43.3) (217.6) 141.6 (76.0) Income Tax Benefit / (Expense) 21.6 (6.9) 14.6 (14.3) 0.3 (14.0) Profit (Loss) For The Period 157.9 (186.6) (28.6) (231.9) 141.8 (90.0) Basic Profit (Loss) Per Share (in $) Diluted Profit (Loss) Per Share (in $) 0.55 0.54 (0.10) (0.10) (0.87) (0.87) (0.34) (0.34) EBITDA: Operating Profit D&A 78.2 37.9 21.1 (0.0) 99.3 37.8 69.6 31.3 7.3 0.0 77.0 31.3 EBITDA 116.1 21.0 137.1 100.9 7.4 108.3
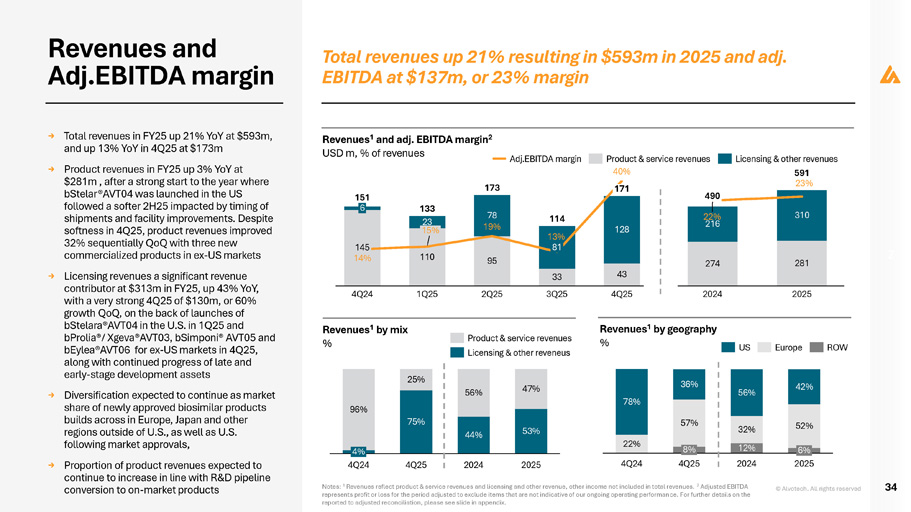
Revenues 1 by mix % Revenues and Adj.EBITDA margin → Total revenues in FY25 up 21% YoY at $593m, and up 13% YoY in 4Q25 at $173m → Product revenues in FY25 up 3% YoY at $281m , after a strong start to the year where bStelar®AVT04 was launched in the US followed a softer 2H25 impacted by timing of shipments and facility improvements. Despite softness in 4Q25, product revenues improved 32% sequentially QoQ with three new commercialized products in ex - US markets → Licensing revenues a significant revenue contributor at $313m in FY25, up 43% YoY, with a very strong 4Q25 of $130m, or 60% growth QoQ, on the back of launches of bStelara®AVT04 in the U.S. in 1Q25 and bProlia®/ Xgeva®AVT03, bSimponi® AVT05 and bEylea®AVT06 for ex - US markets in 4Q25, along with continued progress of late and early - stage development assets → Diversification expected to continue as market share of newly approved biosimilar products builds across in Europe, Japan and other regions outside of U.S., as well as U.S. following market approvals, → Proportion of product revenues expected to continue to increase in line with R&D pipeline conversion to on - market products © Alvotech. All rights reserved 34 Total revenues up 21% resulting in $593m in 2025 and adj. EBITDA at $137m, or 23% margin Notes: 1 Revenues reflect product & service revenues and licensing and other revenue, other income not included in total revenues. 2 Adjusted EBITDA represents profit or loss for the period adjusted to exclude items that are not indicative of our ongoing operating performance. For further details on the reported to adjusted reconciliation, please see slide in appendix. Revenues 1 and adj. EBITDA margin 2 USD m, % of revenues 95 33 43 23 128 200 150 100 50 0 145 14% 6 4Q24 15% 110 1Q25 78 19% 2Q25 13% 81 3Q25 4Q25 151 133 173 114 40% 171 Adj.EBITDA margin Product & service revenues 22% 12% 78% 57% 32% 52% 36% 56% 42% 8% 4Q24 4Q25 2024 6% 2025 US Europe ROW 274 281 216 310 25 20 15 10 5 0 40 600 35 500 30 400 25 300 20 15 200 10 100 5 0 0 22% 2024 2025 490 Licensing & other revenues 591 23% 75% 44% 53% 96% 25% 56% 47% 4% 4Q24 4Q25 2024 2025 Product & service revenues Licensing & other reveneus Revenues 1 by geography %
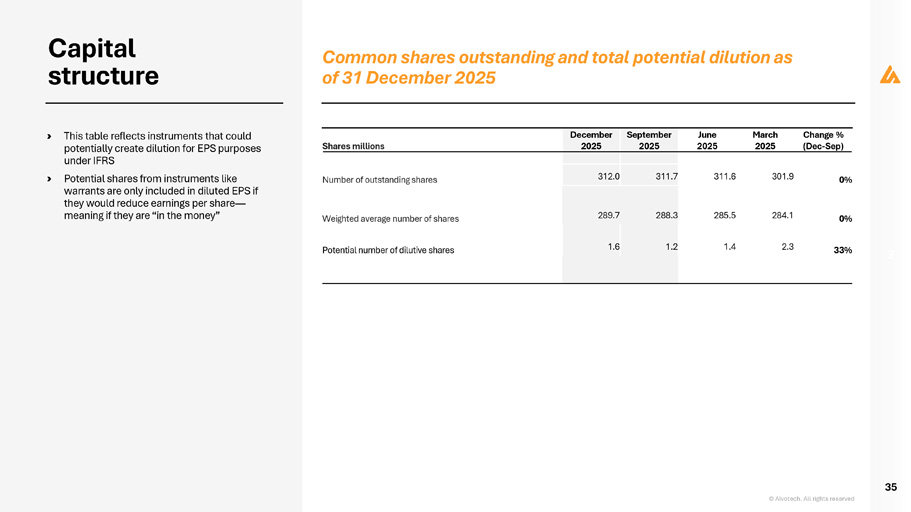
Capital structure › This table reflects instruments that could potentially create dilution for EPS purposes under IFRS › Potential shares from instruments like warrants are only included in diluted EPS if they would reduce earnings per share — meaning if they are “in the money” © Alvotech. All rights reserved 35 Common shares outstanding and total potential dilution as of 31 December 2025 Change % (Dec - Sep) March 2025 June 2025 September 2025 December 2025 Shares millions 0% 301.9 311.6 311.7 312.0 Number of outstanding shares 0% 284.1 285.5 288.3 289.7 Weighted average number of shares 33% 2.3 1.4 1.2 1.6 Potential number of dilutive shares
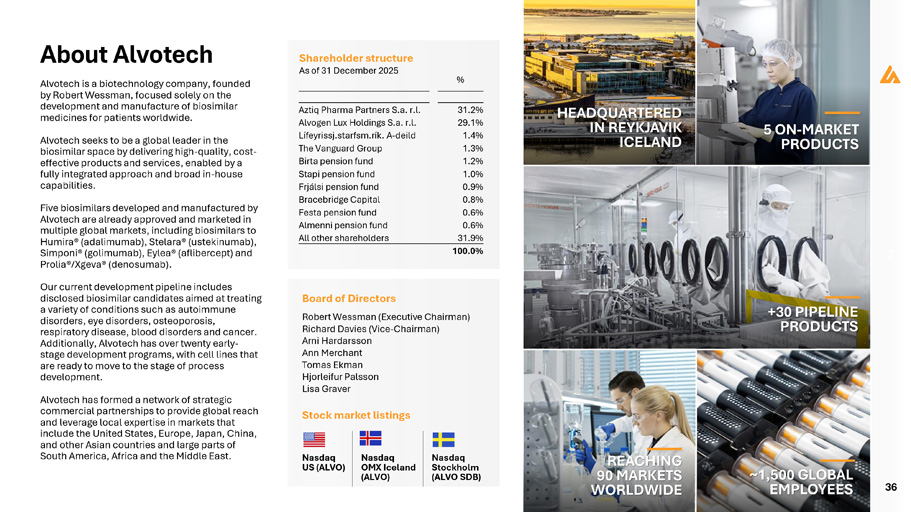
Q4 2025 Earnings Release 36 About Alvotech Alvotech is a biotechnology company, founded by Robert Wessman, focused solely on the development and manufacture of biosimilar medicines for patients worldwide. Alvotech seeks to be a global leader in the biosimilar space by delivering high - quality, cost - effective products and services, enabled by a fully integrated approach and broad in - house capabilities. Five biosimilars developed and manufactured by Alvotech are already approved and marketed in multiple global markets, including biosimilars to Humira® (adalimumab), Stelara® (ustekinumab), Simponi® (golimumab), Eylea® (aflibercept) and Prolia®/Xgeva® (denosumab). Our current development pipeline includes disclosed biosimilar candidates aimed at treating a variety of conditions such as autoimmune disorders, eye disorders, osteoporosis, respiratory disease, blood disorders and cancer. Additionally, Alvotech has over twenty early - stage development programs, with cell lines that are ready to move to the stage of process development. Alvotech has formed a network of strategic commercial partnerships to provide global reach and leverage local expertise in markets that include the United States, Europe, Japan, China, and other Asian countries and large parts of South America, Africa and the Middle East. HEADQUARTERED IN REYKJAVIK ICELAND +30 PIPELINE PRODUCTS 5 ON - MARKET PRODUCTS REACHING 90 MARKETS WORLDWIDE ~1,500 GLOBAL EMPLOYEES % 31.2% Aztiq Pharma Partners S.a. r.l. 29.1% Alvogen Lux Holdings S.a. r.l. 1.4% Lífeyrissj.starfsm.rík. A - deild 1.3% The Vanguard Group 1.2% Birta pension fund 1.0% Stapi pension fund 0.9% Frjálsi pension fund 0.8% Bracebridge Capital 0.6% Festa pension fund 0.6% Almenni pension fund 31.9% All other shareholders 100.0% Shareholder structure As of 31 December 2025 Board of Directors Robert Wessman (Executive Chairman) Richard Davies (Vice - Chairman) Arni Hardarsson Ann Merchant Tomas Ekman Hjorleifur Palsson Lisa Graver Stock market listings Nasdaq US (ALVO) Nasdaq OMX Iceland (ALVO) Nasdaq Stockholm (ALVO SDB)